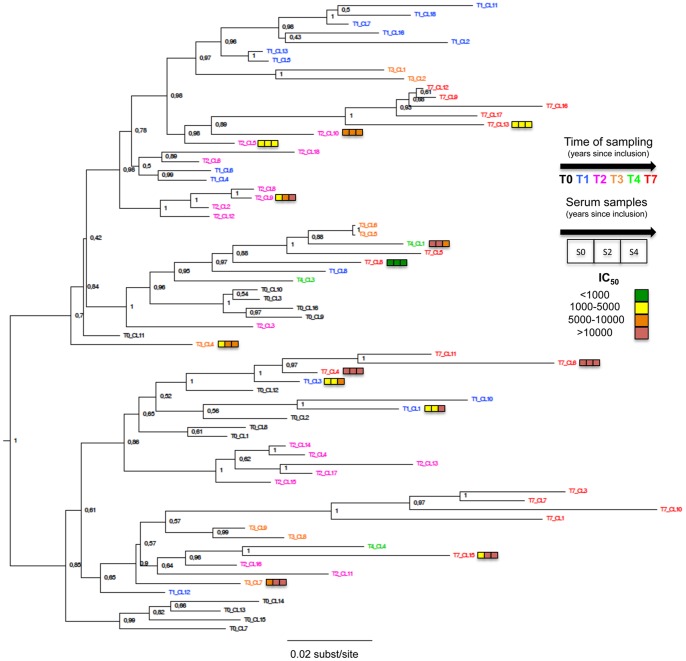
Figure 1. Rooted phylogeny of theHIV-1 env sequences (gp120) obtained from PBMC of patient 05005.
Codes of the different variants are colored depending of time of sampling. Colored squares represent IC50 range of the thirteen pseudoviruses to the three sequential sera (from left to right: S0, S2, S4). For clarity, color code was established: (green) IC50<1,000; (yellow) 1,000< IC50<5,000; (orange) 5000< IC50<10000; (red) IC50>10,000. Node labels indicate the Bayesian posterior probability of the supported branch. Scale bar is expressed as number of nucleotides substitutions/site.

