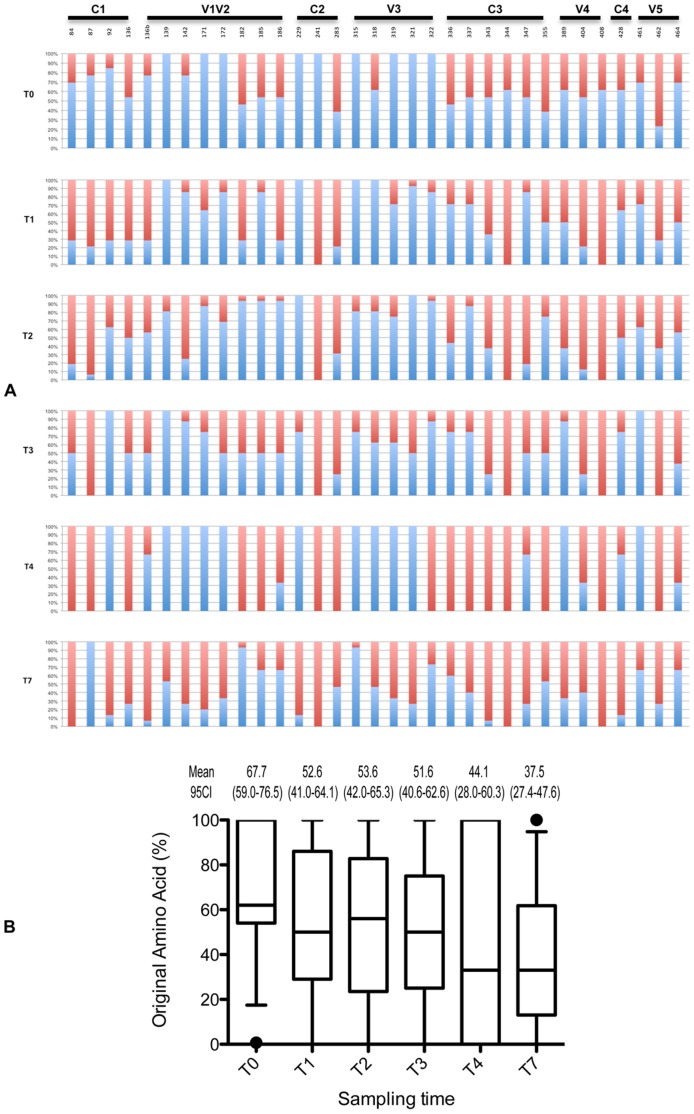
Figure 4. Evolution of the 33 positively selected codons over time.
(A) Each bar represents the percentage of original dominant AA (in blue) and the percentage of variant AA (in red). Positions refer to HxB2 numbering. (B) Evolution of the percentage of original AA over time. Results are shown as distribution of these percentages for each time point. For each distribution, the horizontal lines represent the 10th, 25th, 50th (median), 75th and 90th percentiles. Mean value and 95% confidence intervals (CI 95%) are indicated at the top of each box.

