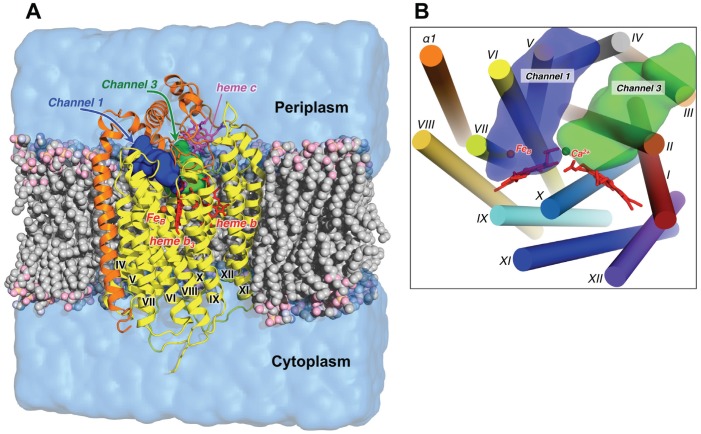
Figure 1.
(A) A setup of a molecular dynamics simulation. A simulation system is composed of Ps. aeruginosa cNOR (PDB ID: 3O0R) [15] embedded in a POPE lipid bilayer membrane and a water solvent box. NorB and NorC subunits are colored in yellow and orange. The heme b, b 3 (red) and c (magenta) groups are shown as sticks and FeB (orange) and Ca2+ (magenta) ions as spheres. Lipid molecules are shown in a sphere representation and water as a transparent light-blue surface. (For clarity of the figure, only some lipid molecules and a part of the water box are shown.) The blue and green surfaces show the positions of two potential proton pathways from the periplasmic side of the membrane, Channels 1 and 3, which are discussed in this work. (B) Arrangement of the cNOR membrane-spanning helices and positions of Channels 1 and 3 as viewed from the periplasm. Transmembrane helices of the NorB subunit are indicated with Roman numerals (I–XII) and a helix of the NorC subunit as α1. (The secondary structure assignment is taken from the crystal structure [15].) Molecular graphics were produced using PyMOL [75].

