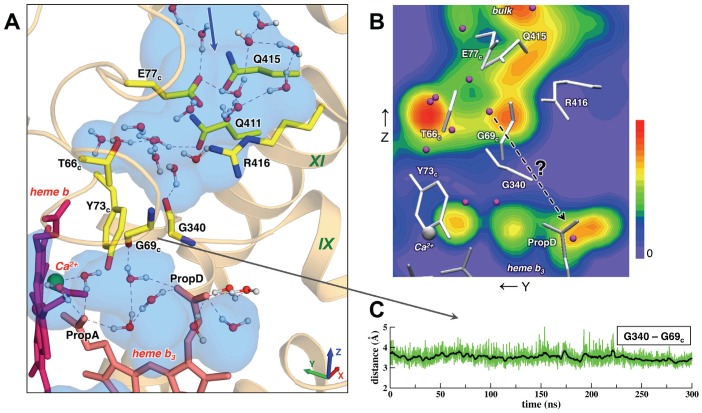
Figure 3. The MD simulation does not support the previously suggested Channel 2 as a possible proton uptake pathway.
(A) A representative MD snapshot (at ∼170 ns) and the calculated water density (the color coding is as in Figure 2a) show that water molecules in the upper hydrophilic region are separated from the water cluster near heme b 3 by two loops (see details in the text). (B) Water density shown as a 2D contour plot (a projection on the YZ-plane; the color coding is as in Figure 2b) and as a density profile along Z-coordinate. (C) Gly340-Gly69c distance time series from the MD simulation.

