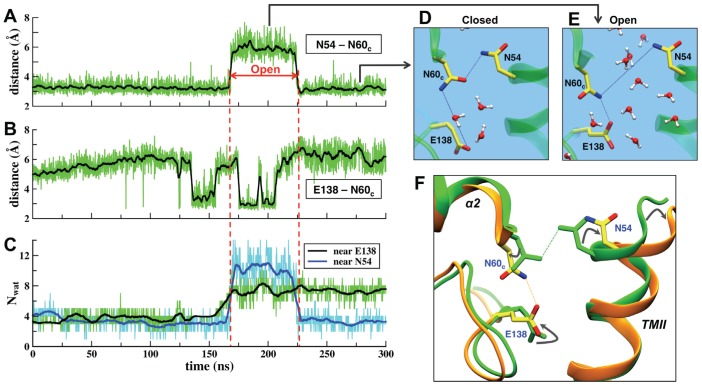
Figure 5. Gating of Channel 3.
(A–C) The time series of the minimal distances between Asn54-Asn60c and Glu138-Asn60c residues and the number of water molecules near sidechains of Glu138 and Asn54 in the MD simulation. The vertical red dashed lines indicate the interval when the Asn-Asn gate is open and the water channel is formed. Glu138 remains well hydrated even after the gate closing. (D–E) Close-up views of the gate region for the closed and open cases. (F) An overlay of the closed (green) and open (orange) structures of the Channel 3 gate region. The conformational changes associated with the gate opening involve rotation of the sidechains of Asn54, Asn60c and Glu138 and tilting of the helix TM II.

