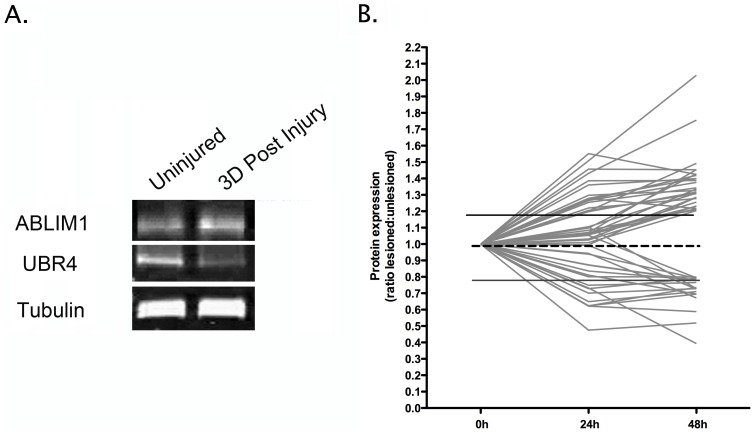
Figure 2. Temporal expression profiling identifies molecular changes occurring in synapse-enriched fractions from the striatum undergoing degeneration.
A. Representative bands from fluorescent western blots for one up-regulated protein (Ablim1) and one down-regulated protein (Ubr4) in degenerating synapse-enriched fractions, validating expression changes observed in proteomic experiments. Tubulin is shown as a loading control. B. Graphical representation of protein expression changes for all 47 proteins modified in degenerating synapse-enriched fractions (see Table 1), illustrating global trends in the magnitude and scope of alterations identified.

