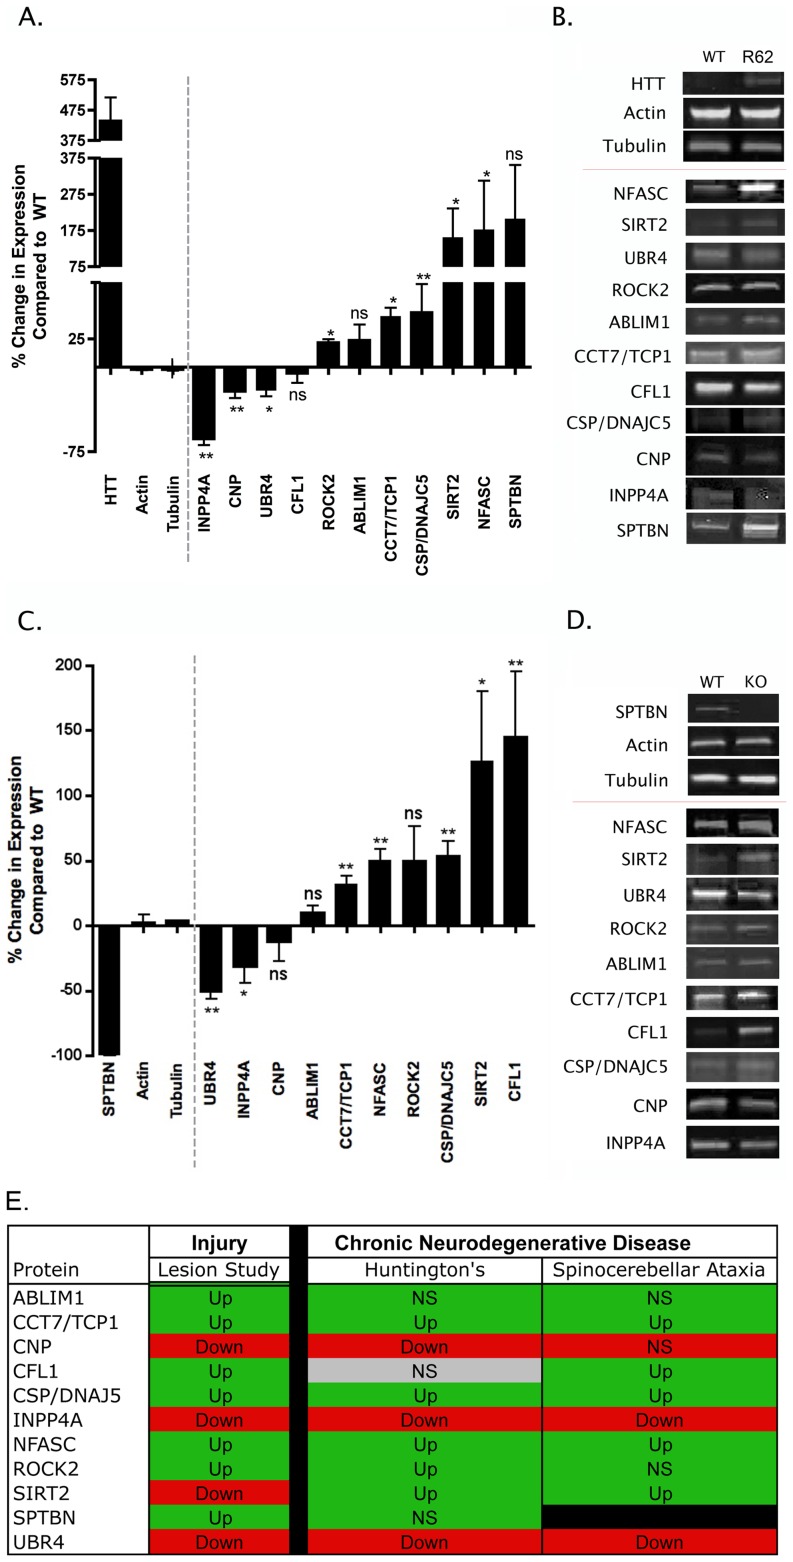
Figure 4. Molecular pathways underlying degeneration in synapse-enriched fractions are conserved across diverse neurodegenerative conditions.
A. Bar chart (mean±SEM) showing quantitative fluorescent western blot data for protein expression levels in synapse-enriched fractions from the striatum generated from the R6/2 transgenic mouse model of HD compared to wild-type controls (N≥3 mice per genotype). Bars to the left of the dotted line show levels of control proteins (including Huntingtin [HTT]). Bars to the right of the dotted line show levels of proteins previously identified following injury (see Table 1). NS = not significant; *P<0.05; **P<0.01; Mann-Whitney test. B. Representative bands from quantitative fluorescent western blot experiments on synapse-enriched fractions from wild-type (WT) and R6/2 mice. C. Bar chart (mean±SEM) showing quantitative fluorescent western blot data for protein expression levels in synapse-enriched fractions from the cerebellum generated from a mouse model of spinocerebellar ataxia type 5 (βIII-spectrin KO mice) compared to wild-type controls (N≥3 mice per genotype). Bars to the left of the dotted line show levels of control proteins (including βIII-spectrin [SPTBN]). Bars to the right of the dotted line show levels of proteins previously identified following injury (see Table 1). NS = not significant; *P<0.05; **P<0.01; Mann-Whitney test. D. Representative bands from quantitative fluorescent western blot experiments on synapse-enriched fractions from wild-type (WT) and βIII-spectrin mice (KO). E. Comparison of protein expression changes in synapse-enriched fractions from the injury model (summarized from the proteomics data), R6/2 mice and βIII-spectrin KO mice. Red boxes indicate mean expression decreased >10%, green boxes indicate mean expression increased >10%, grey boxes indicate changes <10%. Up = significantly upregulated compared to controls; Down = significantly downregulated compared to controls; NS = not significantly changed compared to controls.

