
Figure 2. Cytokine production in infected MΦs.
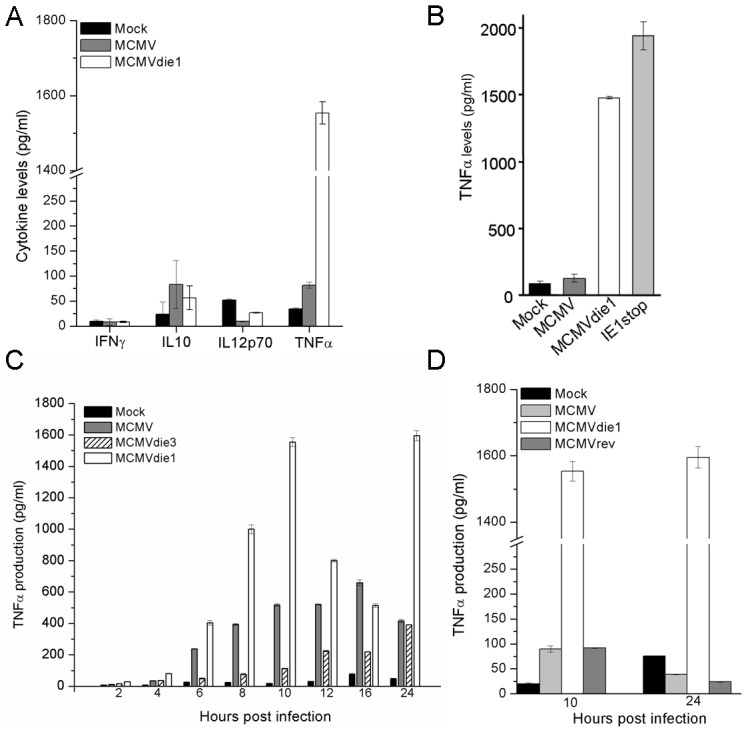
(A) Cells were mock-infected or infected with either MCMV or MCMVdie1 (MOI 1). IFNγ, IL10, IL12p70 and TNFα levels from cellular supernatants at 10 hpi were measured by flow cytometry-based CBA. (B) TNFα production after infection of RAW 264.7 macrophages. Cells were either mock-infected or infected with MCMV, MCMVdie1 or the MCMV IE1stop mutant (MOI 1). TNFα levels from the supernatants were determined by ELISA at 10 hpi. (C) TNFα production after infection of BMMΦ with MCMV, MCMVdie1 or MCMVdie3. Cytokine levels from cellular supernatants were measured by flow cytometry based CBA for 12 h time course, 16 and 24 hpi. (D) TNFα production from mock-infected BMMΦ or MCMV-, MCMVdie1- or MCMVrev-infected cells after 10 and 24 h. Cytokine levels were measured by ELISA. Experiments were done in triplicate and tested in duplicates. Bars show mean values with SE.