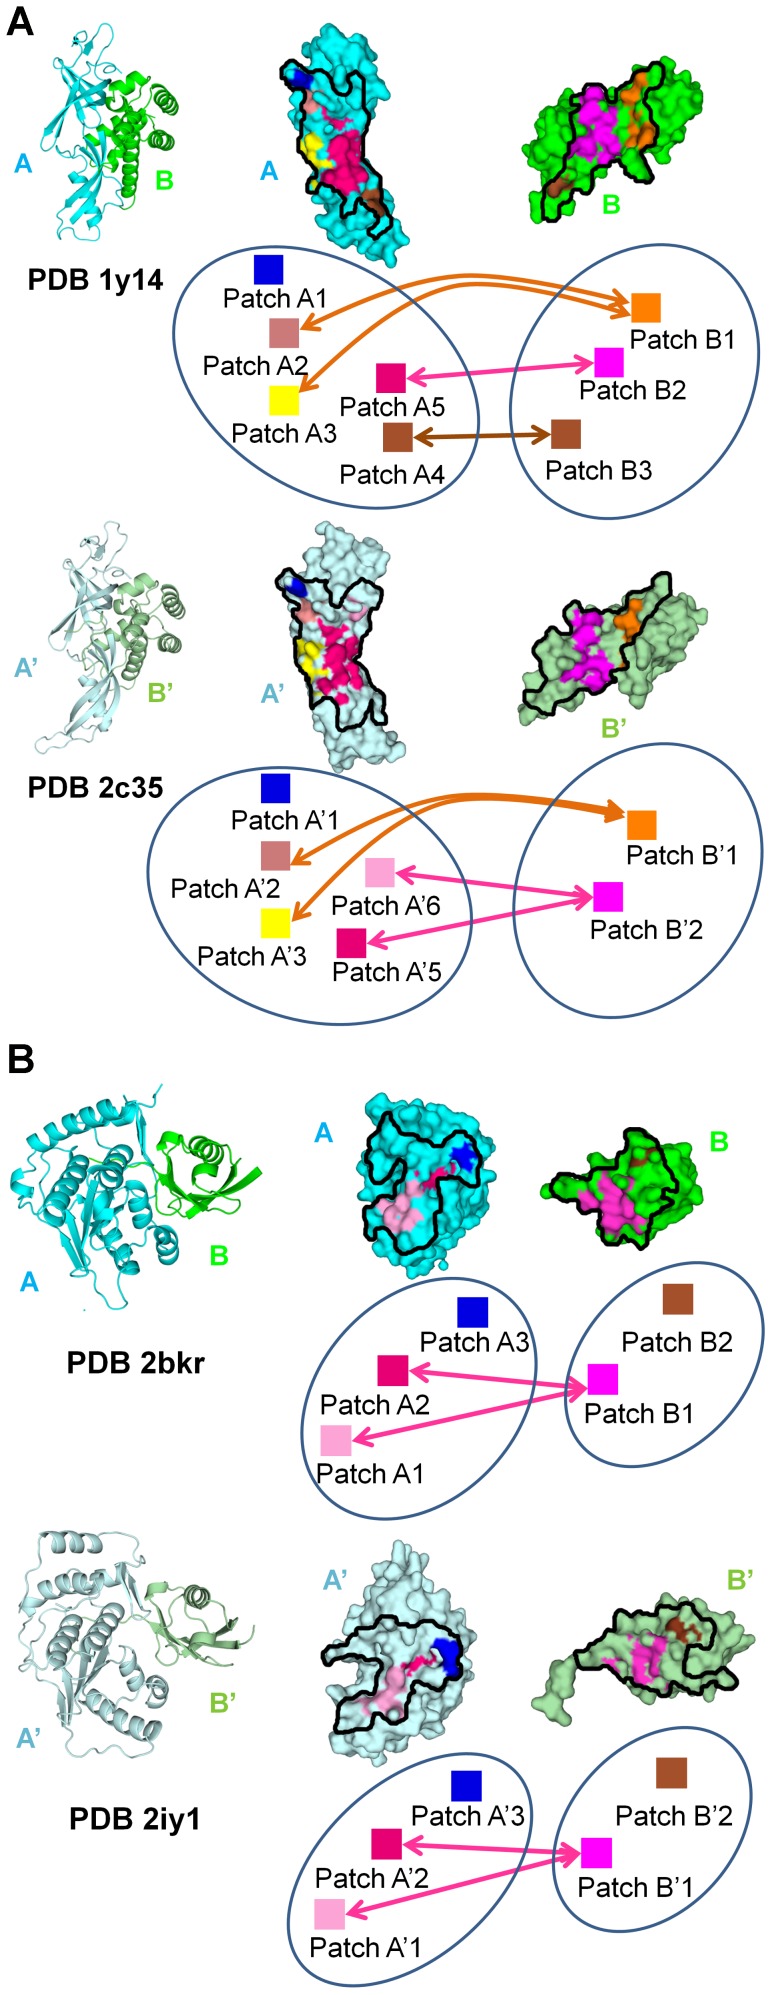
Figure 4. Apolar patches for two pairs of interologs.
In each pair of interologs, the interfaces are split open. The contours of the interface on each chain are delimited by black lines. Patches of the same color in both interologs represent equivalent patches between homologous chains. Patches of identical or similar color on each side of the interface represent patches in contact at interface. For each chain, a diagram is shown with labels describing the relationship between patches (for instance, Patch A1 and Patch A'1 are structurally aligned between interologs) and arrows connecting the apolar patches in contact. (A) Two interologous interfaces sharing 33%; minimum interface sequence identity, between subunits of RNA polymerase 2 in yeast (upper complex, PDB id 1y14) and in human (lower complex, PDB id 2c35); in this case, contact conservation between patches is 84%. (B) Two interologous transient interfaces in human sharing 25% minimum interface sequence identity, NEDD8/NDP1 (upper complex, PDB id 2bkr) and SUMO1/SENP1 (lower complex, PDB id 2iy1); in this case, contact conservation between patches is 100%.

