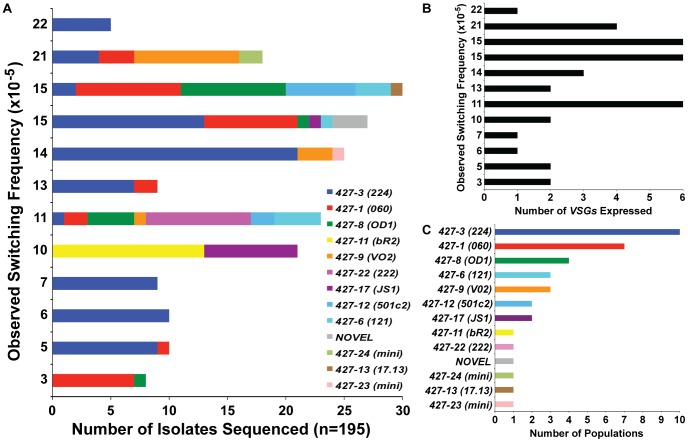
Figure 2. VSGs expressed in TERT−/− short-telomere switched populations.
(A) Depiction of the diversity of VSGs present in specific populations of TERT−/− short-telomere switchers. X-axis shows the number of times each VSG was identified by bacterial colony sequencing versus the OSF value (same as those shown in FIG. 1D) on the y-axis. (B) Correlation of the total number of VSGs expressed in each population (x-axis) versus the OSF of that population (y-axis). (C) The number of populations (out of 12 total) (x-axis) in which each expressed VSG (y-axis) was identified.

