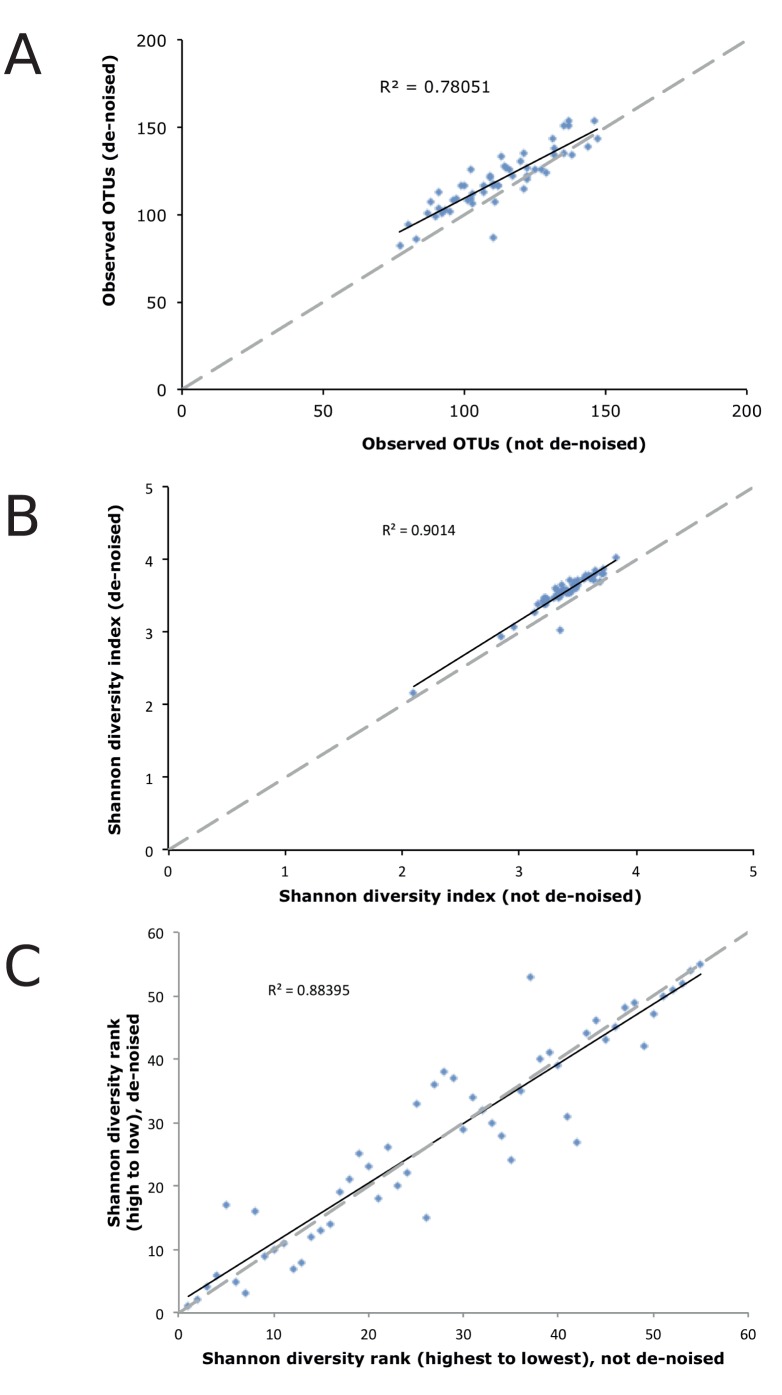
Figure 3. Impacts of de-noising on OTU richness and diversity. A).
Relationship between OTU richness with and without de-noising, by sample. B) Relationship between OTU diversity (Shannon index) with and without de-noising, by sample. C) Ranking of samples by Shannon diversity index with and without de-noising.

