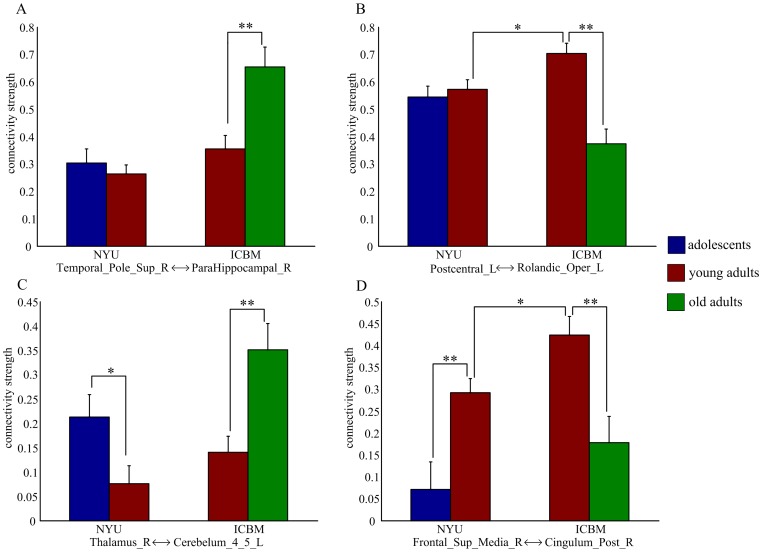
Figure 4. Group- and center-related differences for the developmental trajectories of resting-state functional connectivity shown in Figure 3 .
(A) positive linear change; (B) negative linear change; (C) positive quadratic change; (D) negative quadratic change. The error bars represent standard error of mean. *: p <0.05, **: p <0.005, two-sample t-test.

