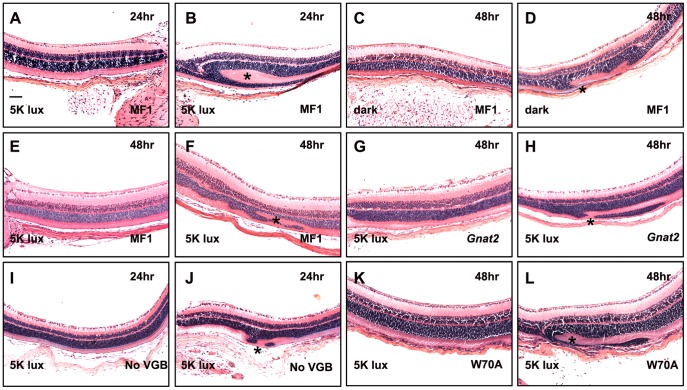
Figure 5. Examples of retinal sections under various conditions in different mutant mice.
Panels show retinas taken from the experiments described in Tables 2 and 3. The frequencies of folding are indicated in the tables. The experimental conditions for each sample are indicated in each panel. Panels B, D, F, H, J, and L show folds (*). Panels A, C, E, G, I, and K show retinas with no detectable folds; samples are shown at the same magnification. Scale bar: 100 µm.

