FIG. 1. .
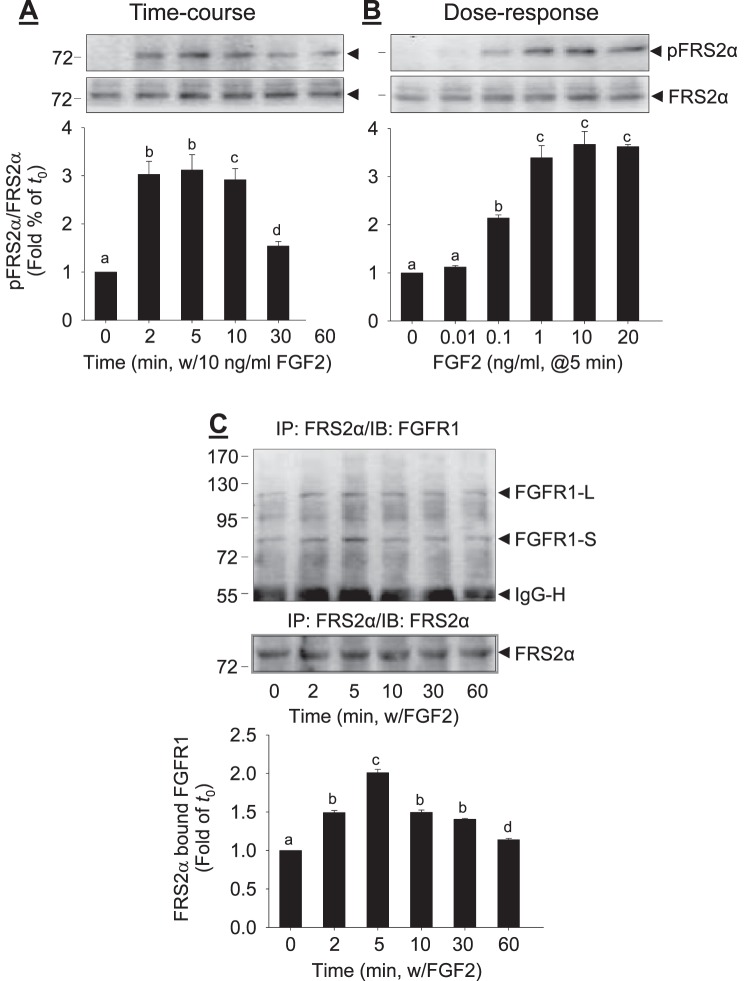
FGF2-induced FRS2α phosphorylation and binding to FGFR1 in oFPAE cells. The cells were treated with 10 ng/ml FGF2 up to 60 min (A) or with increasing concentrations of FGF2 for 5 min (B). Total cell lysates were subjected to immunoblotting analysis of FRS2α phosphorylation. C) Co-IP of FGFR1 and FRS2α. The oFPAE cells were treated with or without FGF2, and total cell lysates were immunoprecipitated with anti-FRS2α antibody. The immunoprecipitates were subjected to immunoblotting with anti-FGFR1 and anti-FRS2α antibodies. Experiments were repeated four times using cells from different pregnant ewes. Band intensities were quantified and expressed as mean ± SD. Bars with different superscripts differ significantly (P < 0.05). FGFR1-L, FGFR1 long form; FGFR1-S, FGFR1 short form; IgG-H, immunoglobin heavy chain.

