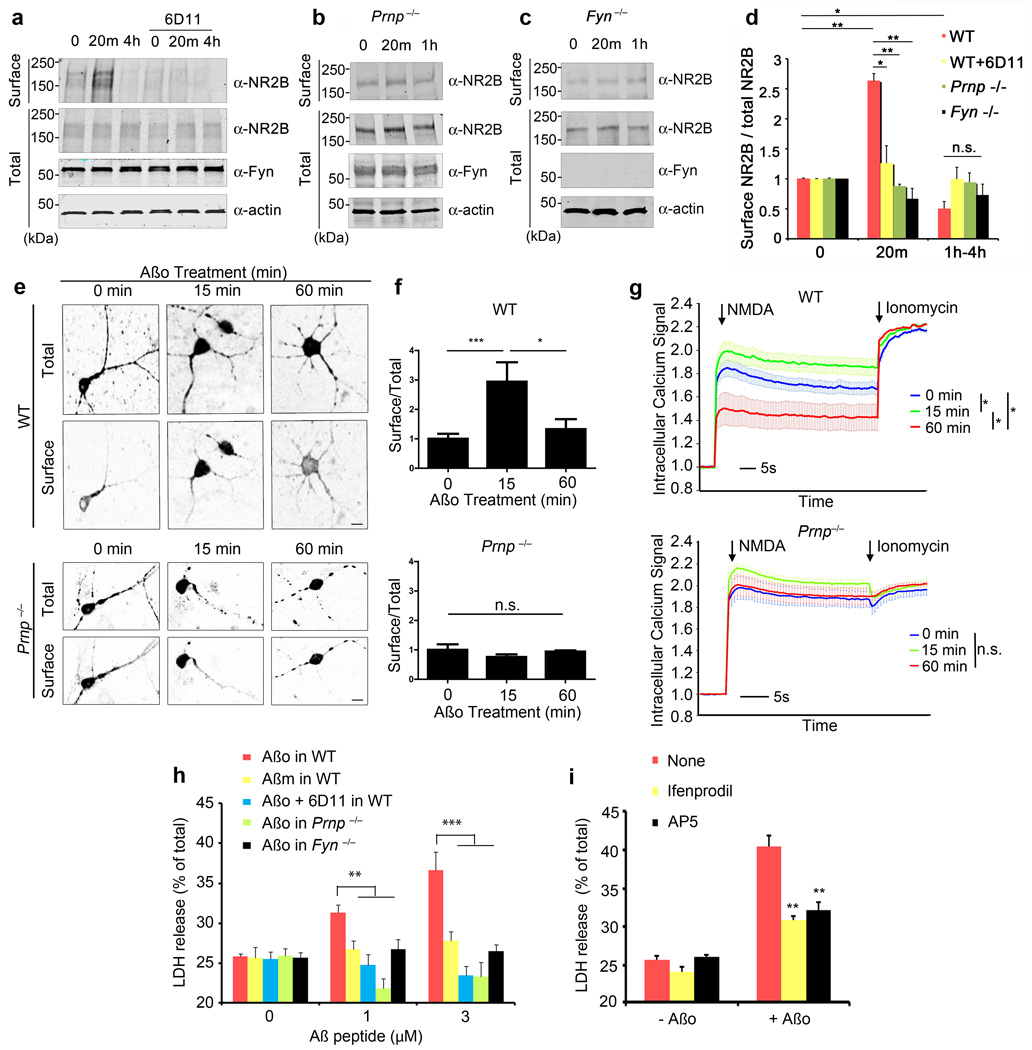
Figure 5. Aβo Induces NR2B Surface Localization, Calcium Signaling and Toxicity via PrPC and Fyn.
a–c WT, Prnp−/− or Fyn−/− E17 cortical neurons after 21 DIV were pre-incubated with or without 10 µg/ml of 6D11 antibody for 1 h, and then treated with 0–1 µM Aβo (monomer equivalent, ~10 nM oligomer) for 20 min or 4 h. Biotinylated cell surface proteins and total lysate proteins were assessed by anti-NR2B, anti-Fyn or anti-Actin immunoblot.
d Quantification of surface expression of NR2B normalized to total NR2B level. Mean ± s.e.m., WT, n = 5; Prnp−/−, n = 3; Fyn−/−, n = 3. *, P < 0.05; **, P < 0.01; one-way ANOVA (F=8.02; df=11), Tukey post-hoc comparisons. Data are normalized to 0 min values; values for biotinylated NR2B in WT, WT+6D11, Prnp−/− and Fyn−/− cultures are 9.6±2.8, 9.1±2.4, 9.9±1.6 and 8.5±2.8, respectively, as a percentage of total NR2B.
e, f WT or Prnp−/− cortical neurons were transfected with expression vector encoding GFP-NR2B, and then treated with 0–1 µM Aβo for 0–60 min. Surface and total receptor were visualized. Scale bars, 10 µm. The graphs in f show the ratio of surface to total receptor as a function of time and genotype. Mean ± s.e.m., n=3 independent embryos per genotype. *, P < 0.05, ***, P < 0.001; one-way ANOVA(F=4.83; df=2), Tukey post-hoc comparisons.
g WT or Prnp−/− cortical neurons were treated with 0–1 µM Aβo for 15 or 60 min. The intracellular calcium response to NMDA (50 µM) or calcium ionophore ionomycin (500 nM) was monitored with FLIPR Calcium 4. Mean ± s.e.m., WT, n = 15 independent wells from 5 embryos; Prnp−/−, n=9 independent wells from 3 embryos. *, P < 0.05 by Repeated Measures ANOVA (F=11.75; df=2) after NMDA addition, Tukey post-hoc comparisons. Data are normalized to pre-NMDA fluorescence; the pre-NMDA values without normalization for WT Aβo 15 m, WT Aβo 60 m, Prnp−/− Aβo 15 min and Prnp−/− Aβo 60 min are 1.05±0.11, 1.06±0.14, 1.11±0.04 and 1.13±0.12, respectively.
h WT, Prnp−/− or Fyn−/− cortical neurons at 21 DIV were treated with 0–2 µM Aβo for 1.5 h, prior to measurement of LDH release. The indicated cultures were pre-incubated with 10 µg/ml of 6D11 antibody for 1 h prior to Aβo, or were treated with Aβ monomer (Aβm) in place of Aβo. Data are mean ± s.e.m of three independent experiments. *, P < 0.05; **, P < 0.01; one-way ANOVA (F=5.73; df=14), Tukey post-hoc comparisons.
i WT neurons were pretreated with 3 µM ifenprodil or 50 µM APV for 1 h, and then Aβo was added at 1 µM. Cell toxicity after 90 min was determined by LDH release. Data represent mean ± s.e.m. from 4 independent experiments. **, P < 0.01; one-way ANOVA (F=70.52; df=5), Tukey post-hoc comparisons relative to no drug.

