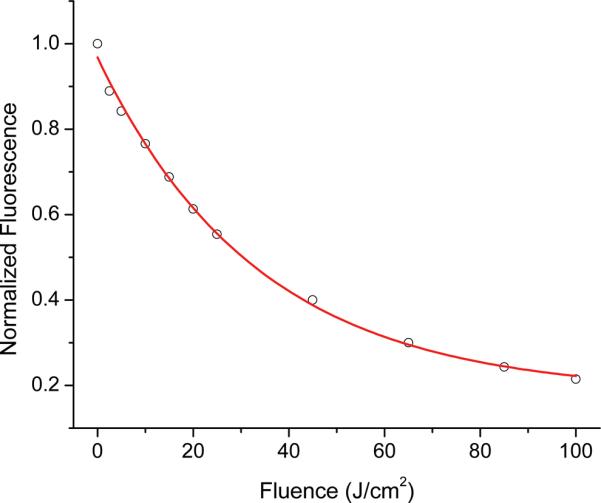
Figure 4.

Photobleaching of Pc 4 fluorescence measured in vivo during delivery of 667 nm treatment light at 50 mW/cm2. Open circles represent the fit coefficient of the Pc 4 basis obtained from SVD fitting, normalized to the magnitude at the beginning of PDT. The solid line corresponds to a single exponential fit to the measured photobleaching, as shown in Equation (1).
