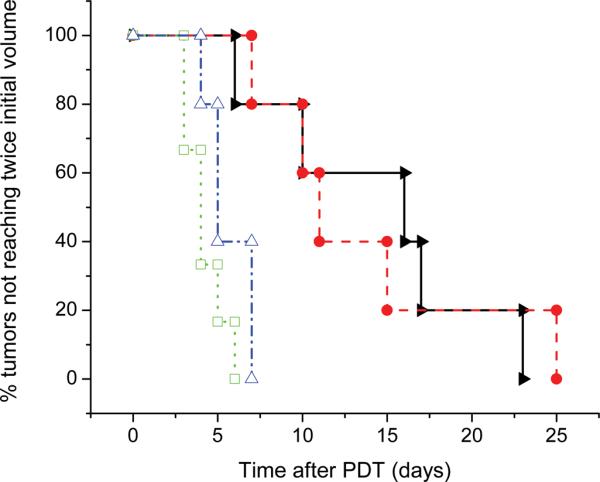
Figure 6.

Kaplan-Meier curves illustrating the effects of fluence rate on response of EMT6 tumors to Pc 4-PDT in vivo. Curves shown are (◻) drug and irradiation free control (n=6); (Δ) 0.03 mg kg−1 Pc 4, drug only control (n=5); (▶) 0.03 mg kg−1 Pc 4, 50 mW/cm2, 100 J/cm2 (n=5); (●) 0.03 mg kg−1 Pc 4, 150 mW/cm2, 100 J/cm2 (n=5). The effect of PDT on tumor growth delay was significant when compared to the effect of drug alone (50 mW/cm2, p = 0.019; 150 mW/cm2, p = 0.036; combined, p = 0.014). The effect of fluence rate on tumor growth delay between treatment groups was not found to be significant (p = 0.857).
