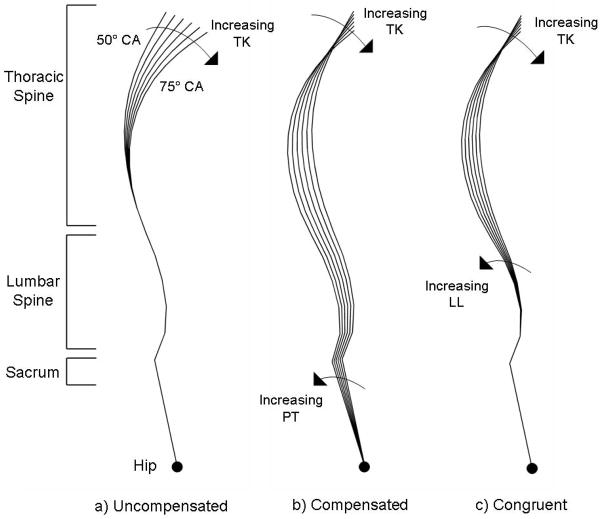
Figure 3.
Schematic representation of the range of spinal curvatures modeled in this study, starting with a) uncompensated posture, b) compensated posture, and c) congruent posture. The T1-T12 Cobb angle was varied from 50° to 75° in 1° increments, but for clarity the images above show only the 5° increments with the extreme spinal curves labeled.

