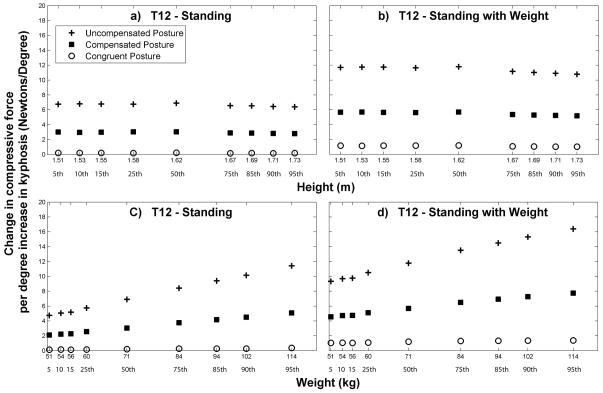
Figure 6.
Increase in T12 compressive loading for every 1° increase in the T1-T12 Cobb angle. These values are the slopes of least-squares linear regressions fitted to the load versus Cobb angle data at T12 for each height/weight combination. Note that when the subject’s height was varied, subject weight was held constant at 71 kg (the 50th percentile value for females) and when the subject’s weight was varied, subject height was held constant at 1.62 m (the 50th percentile value for females).

