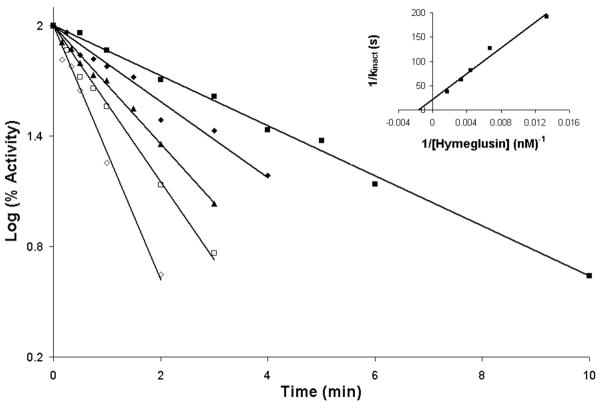
Figure 2.
Time-dependent inactivation of E. faecalis HMG-CoA synthase/mvaS by hymeglusin. Hymeglusin was incubated with HMGCS/mvaS protein for the indicated times prior to addition of acetyl-CoA and DTNB. After recording a baseline level of 412 nm absorbance, acetoacetyl-CoA was added to initiate the activity assay. Reaction mixtures contained: Tris-Cl, 100 mM (pH 8.0); DTNB (0.2 mM); Ac-CoA (400 μM); acetoacetyl-CoA (7 μM); enzyme (2 μg/ml). A semi-log plot of percent HMGCS activity versus time is shown. Concentrations of hymeglusin used were 75 nM (■), 150 nM (◆), 225 nM (▲), 300 nM (□) and 600 nM (◇). Progress curves were fit to a linear model with R2 values of greater than 0.97. Inset: Replot of the reciprocal of apparent kobserved values (derived from t ½ values of data sets depicted in the main figure) versus the reciprocal of hymeglusin concentration. Intercepts on the x and y axes were used to determine KI = 606 nM and kinact= 2.75 min−1, respectively. Nonlinear regression fits to the primary data were also performed (GraphPad Prism 4) and indicate KI=700±18.5 nM and kinact= 3.5±0.6 min−1 (Table 2).

