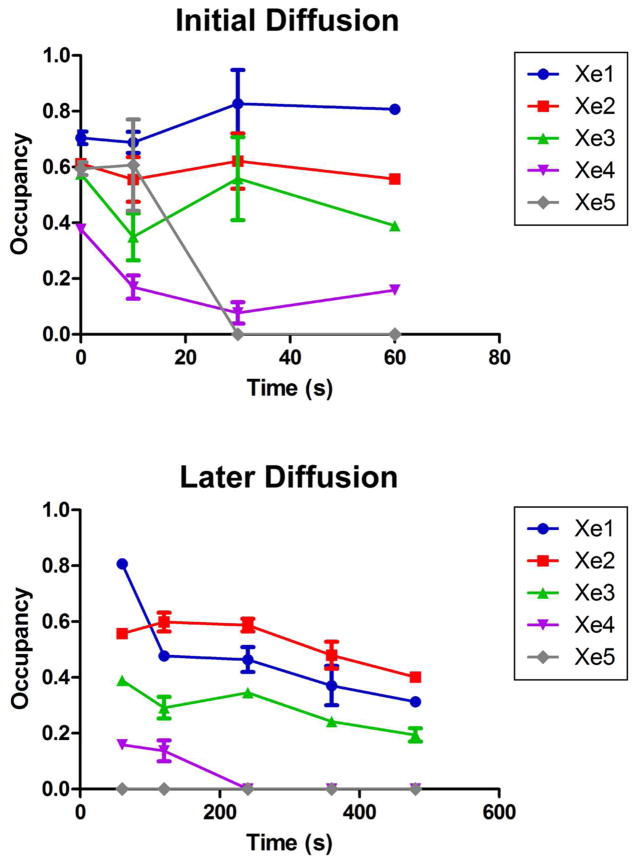
Figure 3.
Normalized occupancies at each Xe site plotted vs. time. Error bars represent standard error, s/√n, where s is the standard deviation and n is the number of observations, i.e. data sets at that time point. The top panel shows 0 – 60 sec data points, and the bottom panel shows 60 – 480 sec data points.

