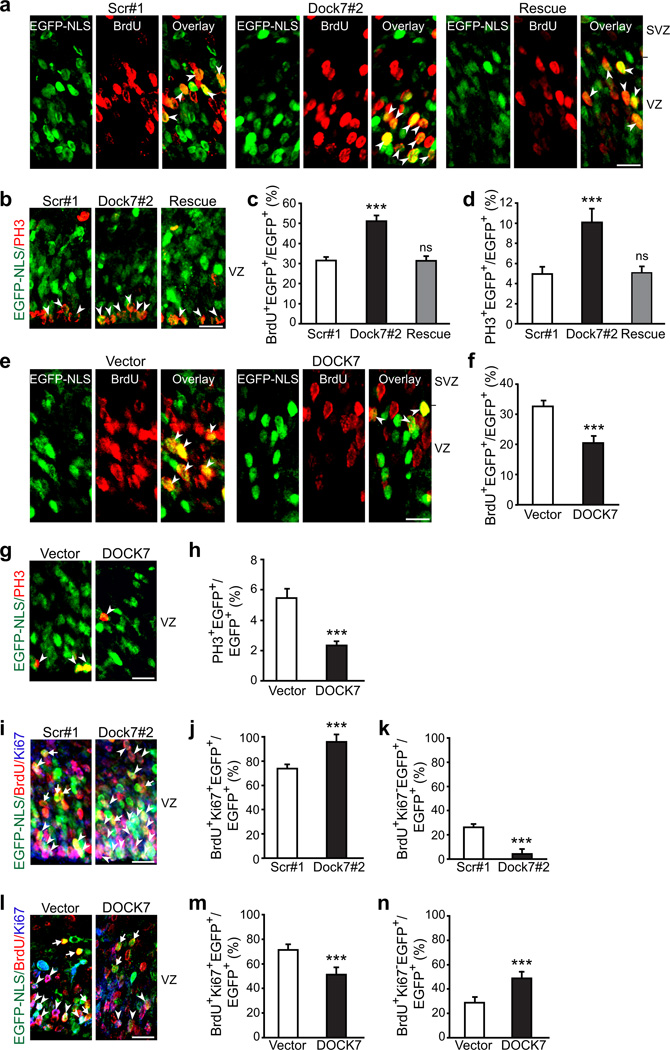
Figure 2.
DOCK7 modulates the VZ progenitor pool size. (a–h) Analysis of proliferating S-phase (BrdU+) and mitotic (PH3+) cells. Mouse embryos were co-electroporated at E13.5 with plasmids expressing EGFP-NLS and non-targeting shRNA (scr#1), Dock7 targeting shRNA (Dock7#2) or Dock7#2 shRNA and FLAG-DOCK7 (rescue) (a–d), or control vector (vector) or FLAG-DOCK7 (DOCK7) (e–h), pulse-labeled with BrdU for 2 h at E15.5 (a,c,e,f), or unlabeled (b,d,g,h). Brain slices were co-immunostained with anti-EGFP and anti-BrdU (a,c,e,f) or anti-PH3 (b,d,g,h) antibodies. (a,b,e,g) Confocal images of the VZ (including SVZ in a,e). Arrowheads indicate transfected cells that are BrdU+ (a,e) or PH3+ (b,g). (c,d,f,h) Quantification of BrdU+ (c,f) or PH3+ (d,h) transfected cells in VZ. Data are mean ± s.e.m.; n = 921–1738 cells for each condition. ***P < 0.001; ns, not significant; one-way ANOVA (c,d) and Student’s t-test (f,h). (i–n) Analysis of cell cycle re-entry and exit. Mouse embryos were electroporated at E13.5 and pulse-labeled with BrdU at E15.5 for 24 h. Brain slices were co-immunostained for EGFP, BrdU and Ki67. (i,l) Confocal images of the VZ. Cycling Ki67+ BrdU+ EGFP-NLS+ cells and Ki67− BrdU+ EGFP-NLS+ cells withdrawn from the cell cycle are indicated with arrowheads and arrows, respectively. (j,k,m,n) Quantification of transfected cells in VZ that continued cycling (BrdU+ Ki67+; j,m) and those that exited the cell cycle (BrdU+ Ki67−; k,n). Data are mean ± s.e.m.; n = 867–1292 cells for each condition.. ***P < 0.001; Student’s t-test. Scale bars, 20 µm. For details on quantifications, see supplemental data.

