Figure 8.
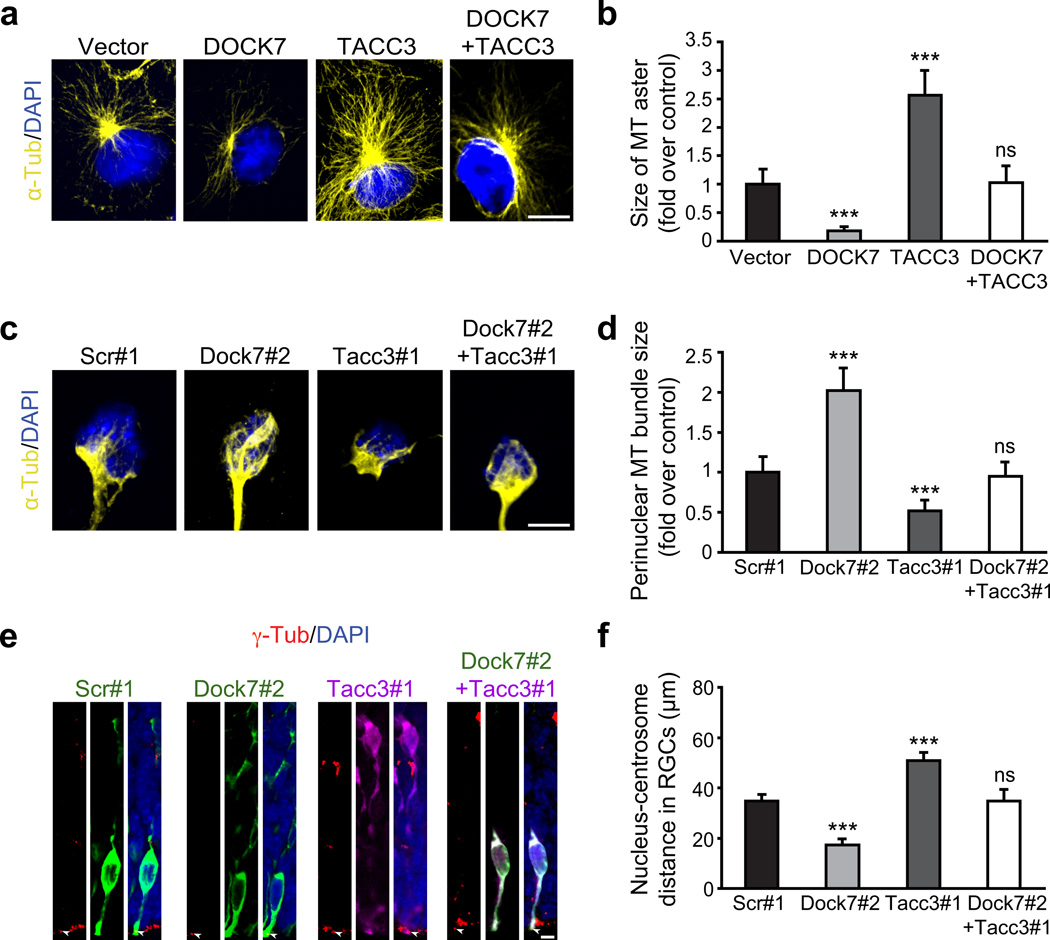
DOCK7 antagonizes microtubule growth-promoting/stabilizing function of TACC3. (a,b) DOCK7 antagonizes TACC3’s ability to increase microtubule aster size in COS7 cells. (a) α-tubulin immunostaining (yellow) and counterstaining with DAPI (blue) of COS7 cells expressing FLAG-DOCK7 (DOCK7) and EGFP-TACC3 (TACC3) alone, or in combination. (b) Measurement of microtubule aster size. The average aster size of control vector transfected cells was set as 1. Data are mean ± s.e.m.; n = 69–115 cells for each condition. ***P < 0.001; ns, not significant; one-way ANOVA. (c–d) Simultaneous silencing of TACC3 prevents enlargement of microtubule “fork”-like structure caused by DOCK7 knockdown in cultured neocortical cells. E12.5 mouse neocortices were transfected with plasmids co-expressing EGFP and scr#1 or Dock7#2 shRNA, RFP and Tacc3#1 shRNA, or both Tacc3#1 and Dock7#2 shRNA-expressing plasmids, and dissociated at E13.5. Cells were cultured for 2 d and immunostained for α-tubulin (yellow) and counterstained with DAPI (blue). (c) Representative images showing microtubule “fork”-like structure in transfected neocortical cells. (d) Measurement of perinuclear microtubule bundle size of “fork”-like structure. The average bundle size of scr#1 shRNA transfected cells was set as 1. Data are mean ± s.e.m.; n = 77–103 cells for each condition. ***P < 0.001; one-way ANOVA. (e–f) Silencing TACC3 rescues decrease in nucleus-centrosome distance caused by DOCK7 knockdown in RGCs in vivo. E13.5 embryos were electroporated as in c, and sacrificed at E15.5. Brain slices were immunostained for γ-tubulin (red), EGFP (green) and/or RFP (purple), and counterstained with DAPI (blue). (e) Examples of transfected RGCs. Arrowheads indicate centrosomes of transfected cells. (f) Quantification of nucleus-centrosome distance. Data are mean ± s.e.m.; n = 215–371 cells for each condition. ***P < 0.001; one-way ANOVA. For details on quantifications, see supplemental data. Scale bars, 10 µm (a) and 5 µm (c,e).

