Fig. 1.
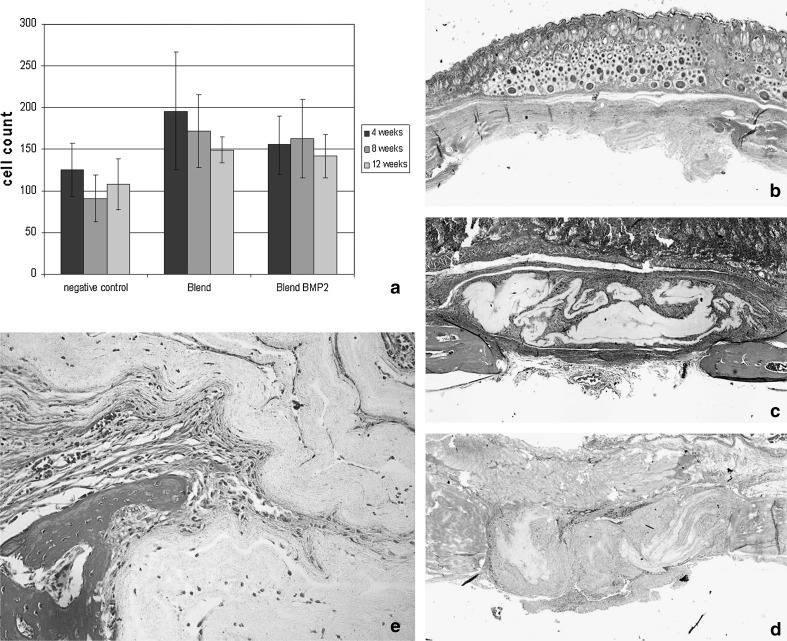
Influence of nanofiber implant on cell densities and callus formation Mean cell densities (a), and Microphotographs of masson goldner stained samples of negative control (b), PLLA-collagen type I (c), and PLLA-collagen type I/BMP-2 (d), 12 weeks after implantation into critical size defects. Detail screen showing cells accumulated mainly in wrinkles or channels (e)

