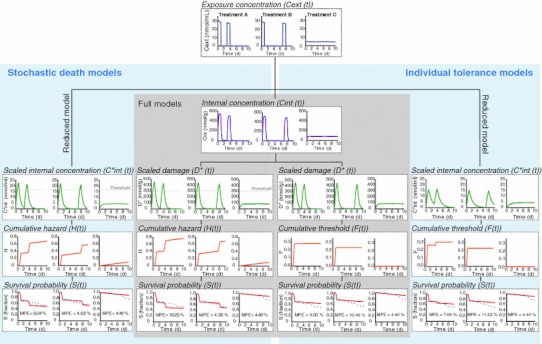
Fig. 3.

The stochastic death and individual tolerance models describing survival of Gammarus pulex in response to propiconazole exposure. Models are described step-by-step, starting from exposure concentrations, followed by internal concentration (full models) and dose metric illustration (scaled internal concentration/scaled damage) and survival model (cumulative hazard H/cumulative threshold F and survival fraction S). The dots in survival probability figures represent measured data in the pulse toxicity experiment. MPE (%) in survival graphs denotes mean percentage error. The models were calibrated using both acute and pulse toxicity data sets, however, only pulsed toxicity data is shown here (for a fit to acute toxicity data, see Fig. SI-4 in supporting information)
