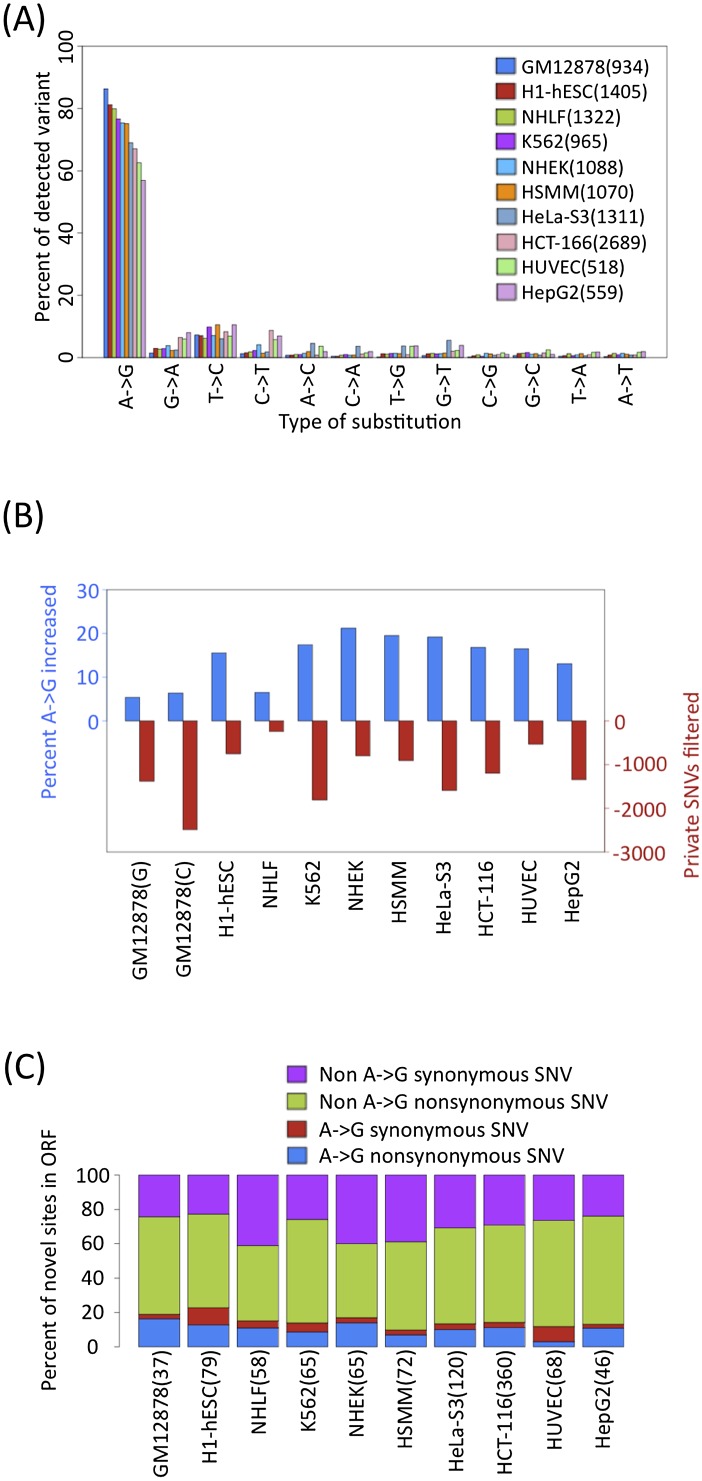
Figure 3.
Survey of SNV calls across ENCODE cell lines. (A) Distribution of nonsplicing novel genic SNVs for all data sets. (B) In every cell type, the percentage of A-to-G SNVs increase and the number of candidate sites decrease (red) after filtering for private SNVs using ChIP-seq. GM12878 calls were filtered with 1000 Genomes or ChIP-seq reads are labeled with G or C, respectively. (C) Relatively few non–A-to-G synonymous SNVs (purple), non–A-to-G nonsynonymous SNVs (green), A-to-G synonymous SNVs (red), A-to-G nonsynonymous SNVs (blue) are found in ORFs.

