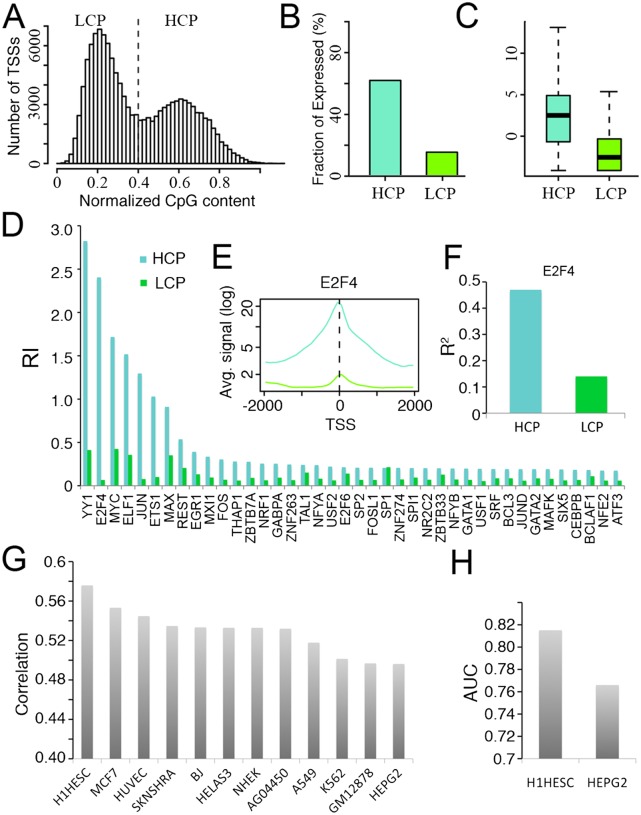
Figure 3.
The relationship between promoter CpG content and expression level. (A) The distribution of normalized CpG content for all human GENCODE TSSs. (B) The fraction of expressed TSSs in HCPs and LCPs. (C) The distributions of expression levels of expressed HCPs and LCPs. (D) The relative importance of each TF in the HCP- and LCP-specific models. (E) The aggregated binding signals of E2F4 around the TSS of HCPs and LCPs. (F) The predictive accuracies of HCP- and LCP-specific models using E2F4 as the single predictor. (G) The Spearman correlation coefficients between normalized CpG content and expression levels in different cell lines (CAGE data for Poly A+ RNA from whole cells). (H) The accuracies of using normalized CpG content to classify expressed and nonexpressed promoters in H1HESC and HEPG2. In B–F, the CAGE expression data for RNA extracted from K562 whole cells are used.

