Figure 5.
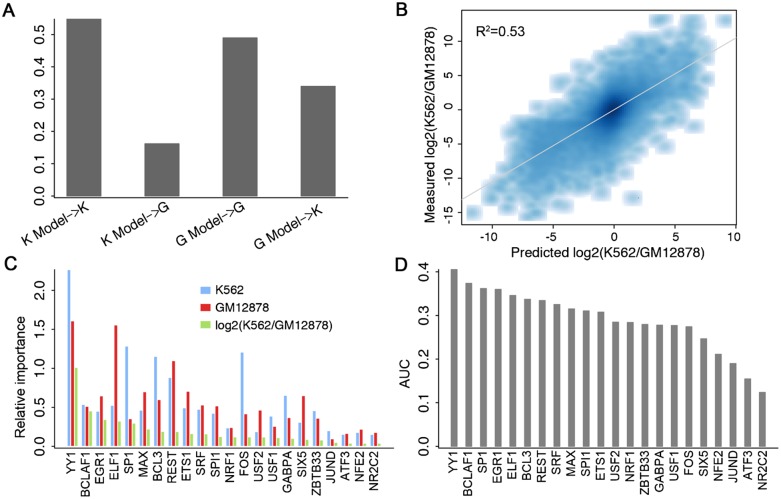
Cell line specificity of the TF model. (A) Models trained and tested on data from the same cell line result in higher predictive accuracies. K Model and G Model represent models trained with data from K562 and GM12878, respectively. (B) Consistency of predicted log2 fold changes with the experimentally measured differences between K562 and GM12878. Differential binding of 22 TFs are used as the predictors in a predictive model of differential expression. (C) The relative importance of TFs in K562- and GM12878-specific models as well as the predictive model for differential expression. (D) The power of each individual TF for classifying K562- and GM12878-specific promoters (log2 fold change >2). CAGE expression data in Poly A+ RNA extracted from K562 and GM12878 whole cells were used in the calculation.

