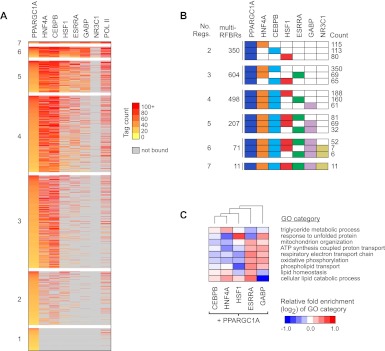
Figure 5.
Recruitment of PPARGC1A to distinct clusters of TF binding sites. (A) Combinatorial binding patterns of PPARGC1A with its network partners displayed as a heatmap. PPARGC1A binding sites were grouped based on the number of bound factors, as indicated to the left of each group. Sites containing two or more factors correspond to PPARGC1A-bound multi-RFBRs. Within each group, binding sites were sorted by decreasing intensity of PPARGC1A binding, based on the number of sequence tags mapping to multi-RFBRs or within 200 bp of the PPARGC1A peak for sites bound by PPARGC1A only. Colors from yellow to red reflect increasing tag count. (Gray) Sites that are not bound by a given TF. TFs are ordered from left to right by decreasing colocalization with PPARGC1A. RNA pol II binding is included for reference in the last column. (B) Predominant regulator combinations at PPARGC1A-bound multi-RFBRs. PPARGC1A-bound multi-RFBRs were grouped based on the number of bound factors as in A. For each group, the total number of multi-RFBRs is listed, along with the top three distinct regulator combinations and the number of times each combination is observed. (Colored boxes) Binding by the respective regulator. (C) Differential enrichment of GO categories among genes occupied by PPARGC1A and each of its network partners. Relative fold enrichment is displayed as a heatmap with columns clustered by similarity. Representative GO categories are shown; the complete set of differentially enriched GO categories is listed in Supplemental Table S9. NR3C1 is excluded due to the small number of targets overlapping with PPARGC1A.

