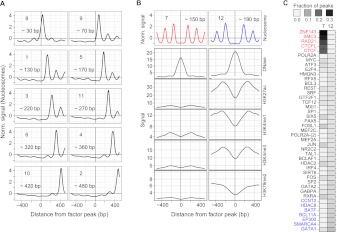
Figure 6.
(A) Asymmetric nucleosome positioning meta-clusters across all TFs in GM12878 and K562. Clusters are numbered according to their size, and labeled with the approximate distance between the binding site and the center of the nearest well-positioned nucleosome. Each panel shows the mean signal over all binding sites (for all TFs and for both cell lines) that were assigned to that cluster. (B) The two symmetric nucleosome meta-clusters not shown in A. For each of these two clusters, we also show the mean signal of other chromatin marks averaged over the binding sites in that cluster. Sites in cluster 12 exhibit remarkably higher signals of active marks. For both clusters 7 and 12, the signal of the associated chromatin marks appears highly symmetric, but this is an artifact of aggregating the chromatin mark signal according to the clustering and orientation of the nucleosome signal. (C) For each TF that was enriched in either cluster 7 or cluster 12 (P < 0.001), we computed the fraction of binding sites in each of these clusters. Cluster 7 is enriched for the members of the CTCF/cohesin complex, while cluster 12 is enriched for enhancer-associated TFs.

