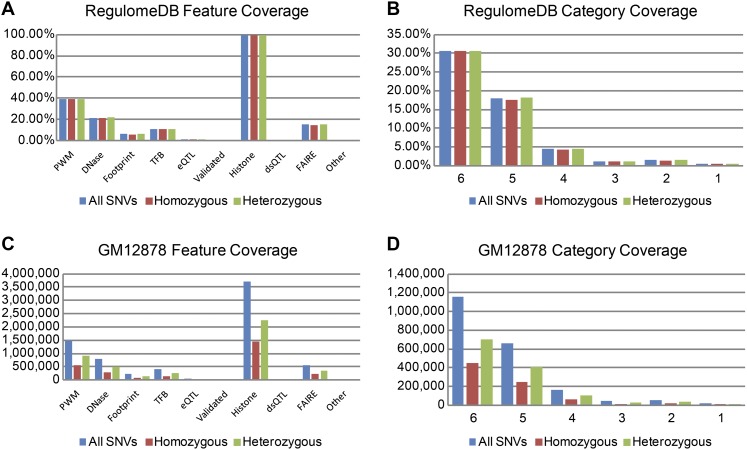
Figure 2.
Incidence of SNVs in features and categories. Average percent count of SNVs in each genomic feature (A) and in each RegulomeDB category (B). Although the differences between homozygous and heterozygous SNV counts are small, they are nevertheless significant (P < 5 × 10⁻¹⁵). Actual SNV count in features (C) and categories for the cell line GM12878 (D).

