
Figure 7.
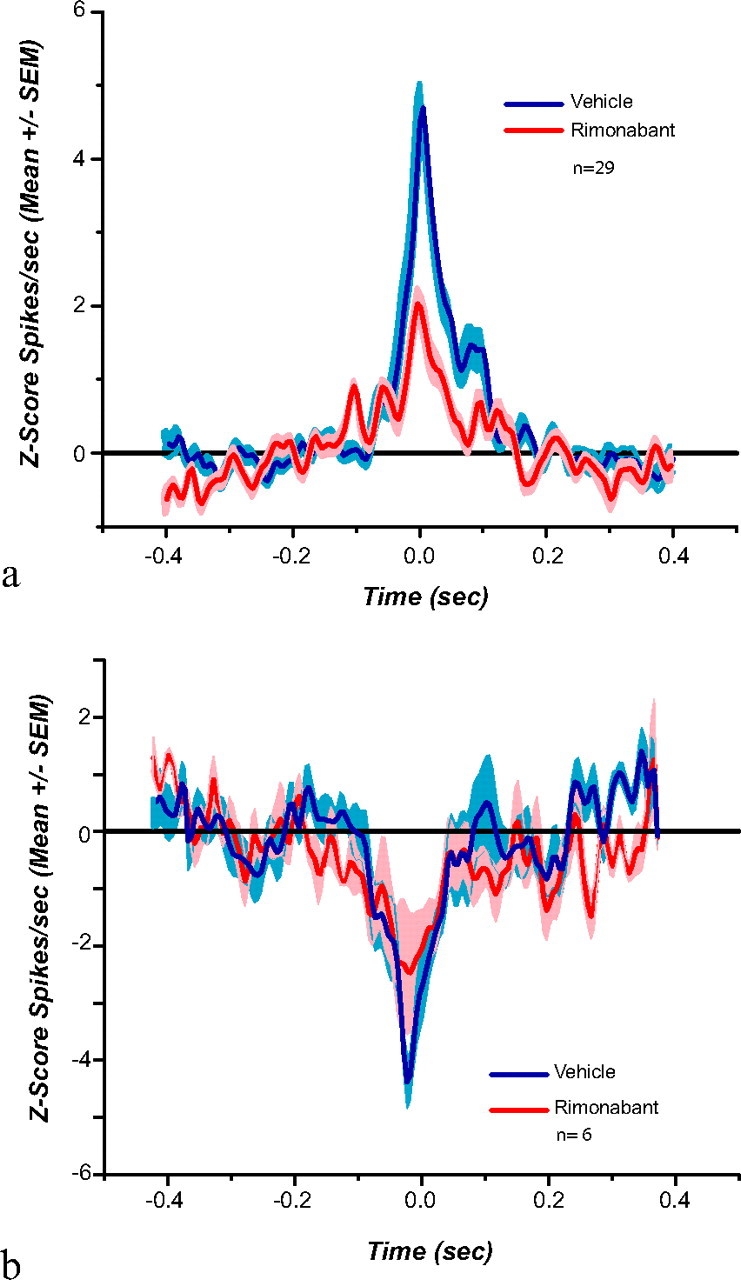
Average (a) peak (n = 29) and (b) trough (n = 6) cross-correlations. Rimonabant significantly reduces positive functional cross-correlations observed among neighboring neurons. Shade indicates SEM.
Official websites use .gov
A
.gov website belongs to an official
government organization in the United States.
Secure .gov websites use HTTPS
A lock (
) or https:// means you've safely
connected to the .gov website. Share sensitive
information only on official, secure websites.
Average (a) peak (n = 29) and (b) trough (n = 6) cross-correlations. Rimonabant significantly reduces positive functional cross-correlations observed among neighboring neurons. Shade indicates SEM.