
Figure 1. Results from x-ray scattering.
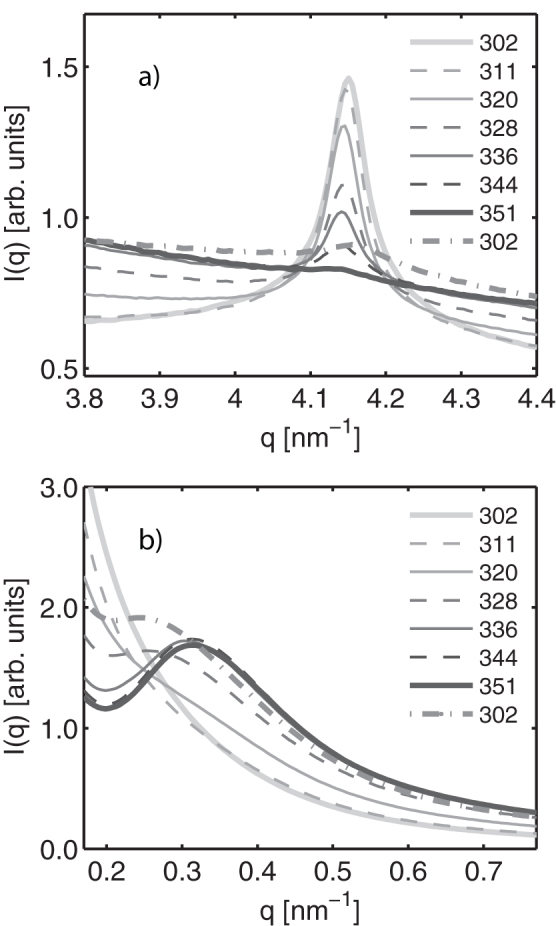
The figures show the azimuthally integrated scattered intensity as a function of the scattering vector q, recorded at increasing temperatures around (a) the 001 Bragg peak and (b) at small angles. Samples were prepared by dispersing Na-fluorohectorite in 10 mM NaCl solution at a clay content of 3 wt%. The dispersions were stored vertically for 10 days prior to measurement, allowing for some sedimentation. Diffractograms were recorded near the bottom of the capillaries where the concentration of particles was roughly 10 wt%24. The scattering curves were recorded with an exposure time of 1.5 minutes starting 3 minutes after a given target temperature was achieved, with the ramp from one temperature plateau to the next lasting 10 minutes. Complimentary measurements with longer waiting times at the temperature plateaus showed no further changes in the scattering at any of the investigated temperatures, indicating that a stable state was reached quickly on the length scales investigated. The last dataset at 302 K was recorded post-heating after 24 hours of room temperature storage. The curves were normalized taking into account the incoming photon flux and the transmission of the sample.