
Figure 4. Results from conductivity measurements.
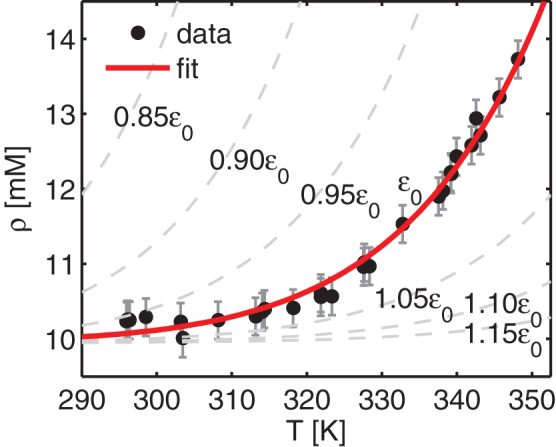
The figure shows the concentration of monovalent charge carriers as a function of solution temperature during heating of a 1.0 wt% Na-fluorohectorite dispersion in 10 mM NaCl (•). The error bars reflect the estimated precision of the measurements, which was derived by performing the same measurements on a NaCl solution with a comparable and known ion concentration. The heating rate was the same as that employed in the x-ray experiments. The temperature dependence of the conductivity due to the increased mobility as a function of temperature was corrected for. When converting from conductivity to charge carrier concentration, we have assumed all charge carriers to be monovalent and that the solution conducts the same amount of current as a NaCl solution would with the same number of charge carriers. The acidity was measured throughout the experiments to be between 9.50 and 9.75 pH, thus giving a negligible contribution to the conducted current. The solid line (–) is the fit as described in the text with ε = ε0 = –51.8 kJ/mol, and the dashed lines (--) the equilibrium concentrations projected for small deviations from ε0.