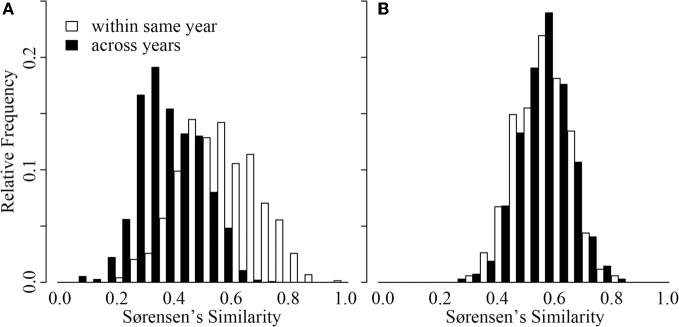
Figure 4.
Distribution of Sørensen's similarity indices for samples collected within the same year (open bars) and samples collected across years (black bars) from Crystal Bog (A) and Lake Mendota (B). Comparisons were conducted using 68 samples from CB collected in 2003, 2005, and 2007 (previously unpublished), and 46 samples from ME collected in 2000, 2001, and 2005 (Shade et al., 2007).

