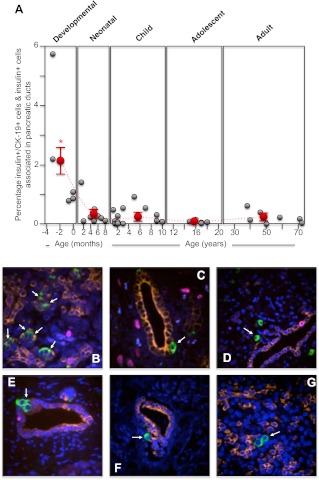
Fig. 4.
The incidence of human pancreatic islet β-cell neogenesis from midgestation to adult. Human pancreatic sections were analyzed by immunofluorescence and confocal microscopy as outlined in Materials and Methods for insulin (green), CK-19 for pancreatic ductal cells (orange), Ki67 for proliferating cells (purple), and nuclei (4′,6-diamidino-2-phenylindole; blue). The number of insulin-positive cells emerging and/or associated with CK-19-positive ductal cells as well as insulin-positive/CK-19-positive coexpressing cells were counted and calculated as a percentage of all insulin-positive cells in each section. A, Incidence of β-cell neogenesis for each human specimen during the developmental, neonatal, childhood, adolescent, and adult periods (gray circles). The mean ± sem incidence of β-cell neogenesis for each period is shown as red circles. *, Significant difference (P ≤ 0.001) from the average β-cell neogenesis found in adult islets. The dashed line indicates the trend in change of the average incidence of β-cell neogenesis between the different life periods (note that the x-axis time scale is different for each period); B, example image of a human 24-wk-old premature pancreas (×60 magnification); C, example image of a human 24-wk-old premature pancreas (×60 magnification); D, example image of a human full-term pancreas (×40 magnification); E, example image of a human 1-yr-old pancreas (×60 magnification); F, example image of a human 15-yr-old pancreas (×40 magnification); G, example image of a human 39-yr-old pancreas (×60 magnification).

