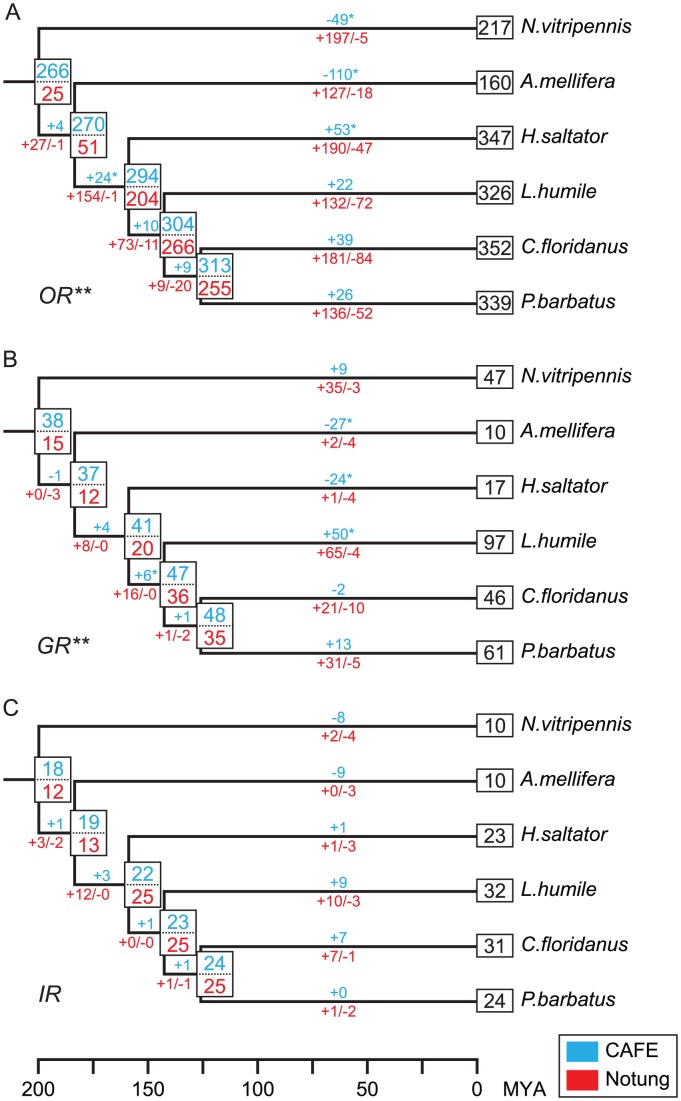
Figure 5. Estimated numbers of gene birth-and-death events and ancestral gene copies for chemosensory gene families.
(A) OR family. (B) GR family. (C) IR family. The results of CAFÉ and Notung are highlighted in blue and red, respectively. Numbers above branches indicate net copy number changes estimated by CAFÉ. Numbers below branches with plus and negative signs indicate the number of gene gain and loss events estimated by Notung, respectively. Single asterisk indicates significant branch-specific expansions/contractions. Double asterisk indicates gene families that significantly violate the random gene birth and death assumption of CAFÉ. The phylogeny of Hymenoptera and the time scale are from [1], [102].

