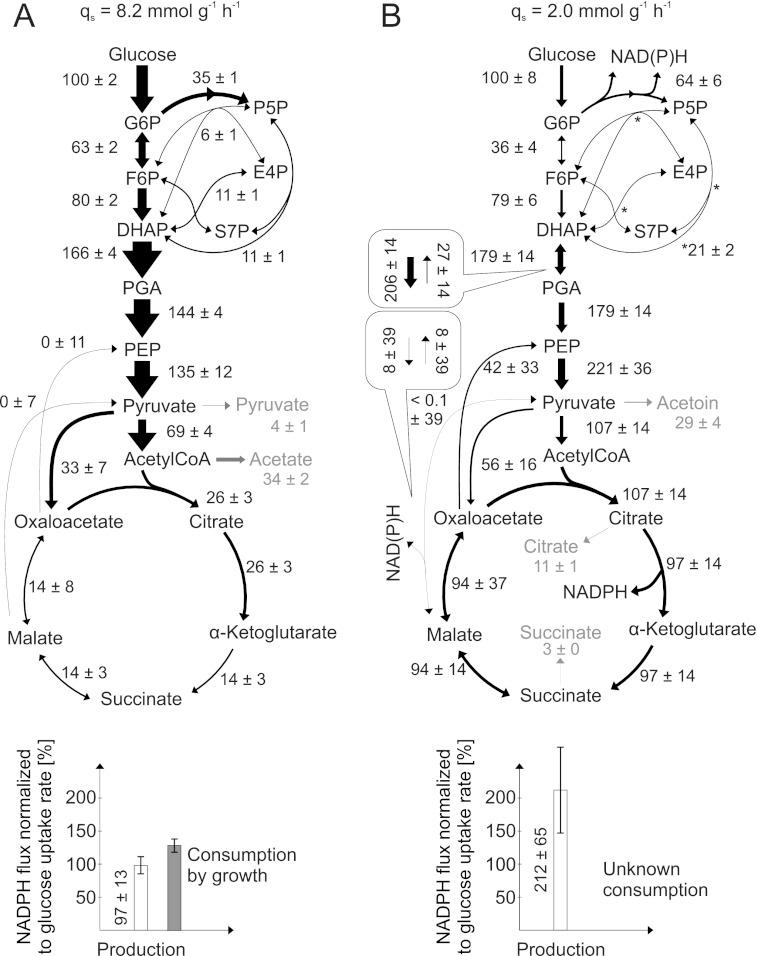
FIGURE 1.
Relative distribution of intracellular fluxes in exponentially growing batch (A) and nitrogen starvation-induced resting B. subtilis cultures (B). The 13C-labeling experiment was performed with 20% (w/w) [U-13C] and 80% (w/w) [1-13C]glucose, using LC-MS/MS for 13C-pattern determination in metabolic intermediates. Flux values are normalized to the specific glucose uptake rate of each culture, whereas arrow sizes are relative to the glucose uptake rate of batch-grown B. subtilis wild-type. Boxes refer to the estimated forward and backward fluxes. Errors are S.D. obtained from error propagation using multivariate statistics (22, 38). G6P, glucose 6-phosphate; DHAP, dihydroxyacetone phosphate; E4P, erythrose 4-phosphate; F6P, fructose 6-phosphate; PGA, phosphoglycerate; PEP, phosphoenolpyruvate; P5P, pentose 5-phosphate; S7P, sedoheptulose 7-phosphate.

