
FIGURE 3.
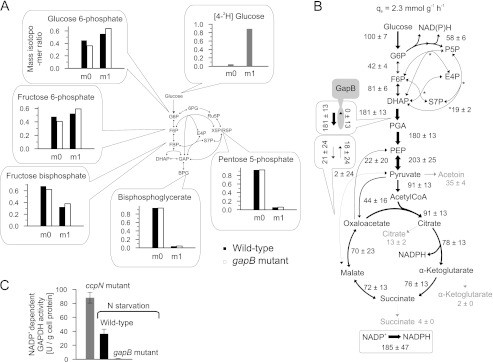
Quasi isotopic steady state 2H-labeled distribution (A), intracellular fluxes (B), and in vitro GapB activity (C) of B. subtilis wild-type and gapB mutant. 2H-Labeling was achieved by feeding 100% [4-2H]glucose to resting wild-type and gapB deletion mutant. Unlabeled molecules are denoted as m0, and single 2H-labeled molecules are labeled as m1. The relative distribution of intracellular fluxes in a nitrogen starvation-induced resting gapB mutant was obtained by LC-MS/MS analysis of 13C-pattern in intermediates upon labeling with 20% (w/w) [U-13C] and 80% (w/w) [1-13C]glucose. Flux values are normalized to the glucose uptake rate, whereas arrow size is relative to glucose uptake rate of an exponentially growing B. subtilis wild-type batch culture (as shown in Fig. 1A). Boxes refer to the forward and backward fluxes. As a positive control, in vitro GapB activity was determined in crude cell extracts of an exponentially growing ccpN mutant (50), where the error bars represent technical replicates. G6P, glucose 6-phosphate; DHAP, dihydroxyacetone phosphate; E4P, erythrose 4-phosphate; F6P, fructose 6-phosphate; PGA, phosphoglycerate; PEP, phosphoenolpyruvate; P5P, pentose 5-phosphate; S7P, sedoheptulose 7-phosphate; N, nitrogen.