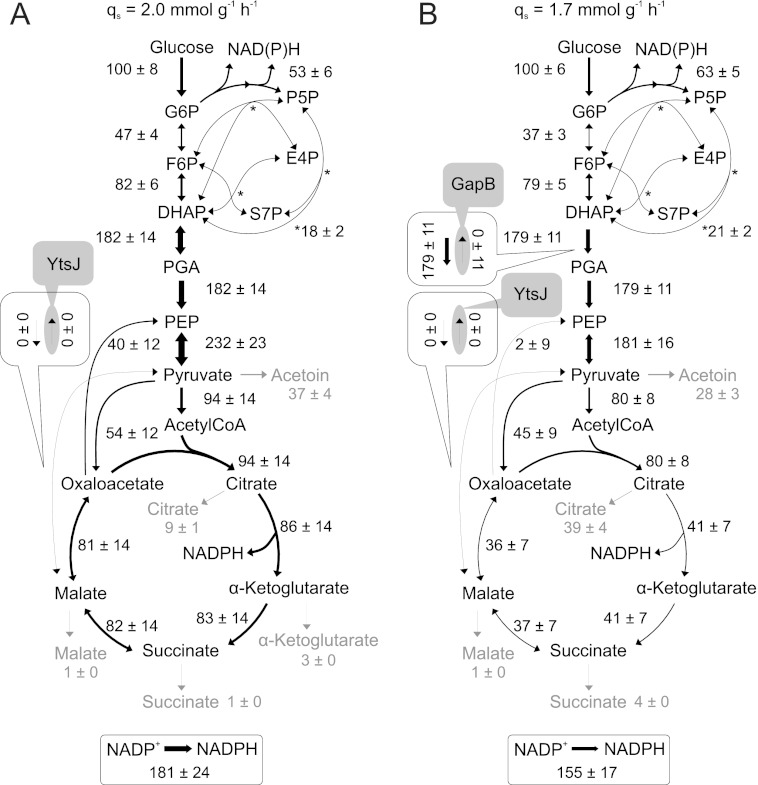
FIGURE 4.
Relative distribution of intracellular fluxes in nitrogen starvation-induced resting cultures of a B. subtilis ytsJ mutant (A) and ytsJ/gapB double mutant (B). 13C-Labeling pattern were detected by LC-MS/MS in metabolic intermediates from a 20% (w/w) [U-13C] and 80% (w/w) [1-13C]glucose experiment. Flux values are normalized to each cultures glucose uptake rate, whereas arrow sizes are relative to the glucose uptake rate of batch-grown B. subtilis wild-type (shown in Fig. 1A). Boxes refer to the forward and backward fluxes, and gray areas indicate the deleted enzymatic reaction. G6P, glucose 6-phosphate; DHAP, dihydroxyacetone phosphate; E4P, erythrose 4-phosphate; F6P, fructose 6-phosphate; PGA, phosphoglycerate; PEP, phosphoenolpyruvate; P5P, pentose 5-phosphate; S7P, sedoheptulose 7-phosphate.

