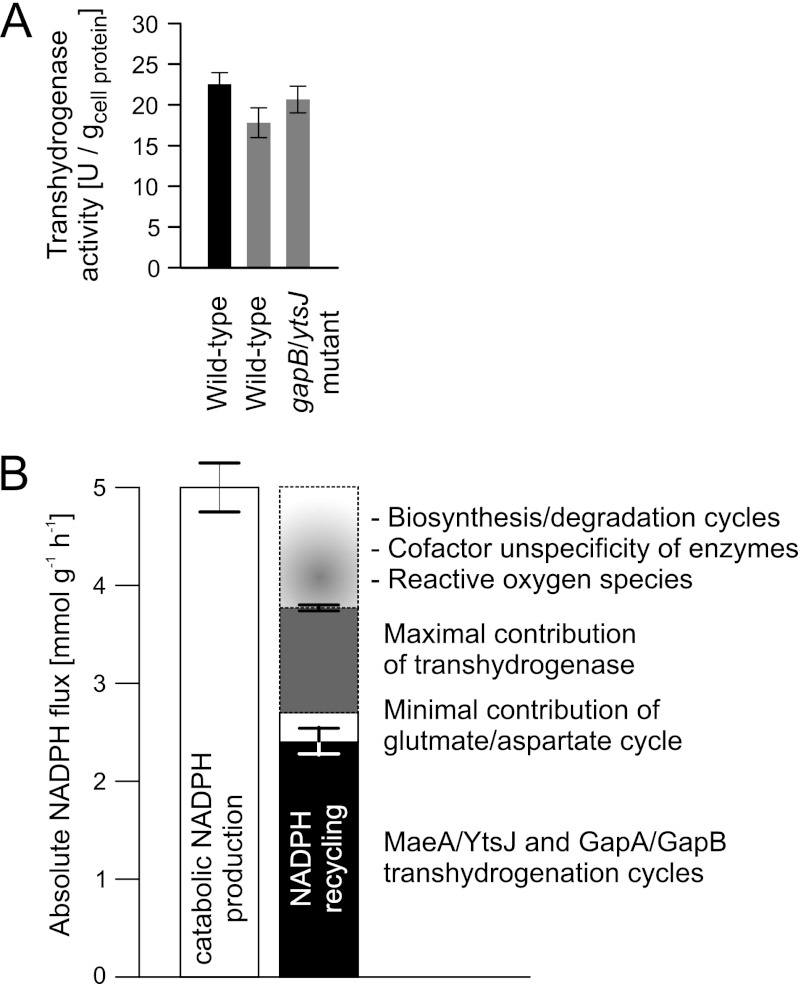
FIGURE 6.
Transhydrogenase activity (A) and quantification of NADPH balancing processes in nitrogen starvation-induced resting B. subtilis (B). Transhydrogenase activity was determined in crude cell extracts of exponentially growing B. subtilis wild-type (black bar) and of resting wild-type and ytsJ/gapB double mutant (gray bars), where error bars represent technical replicates. The error bars on the NADPH balancing reactions represent the confidence region of the 13C-flux estimates for the cycles, and the error bars from the in vitro data represent the transhydrogenase activity. U, units.

