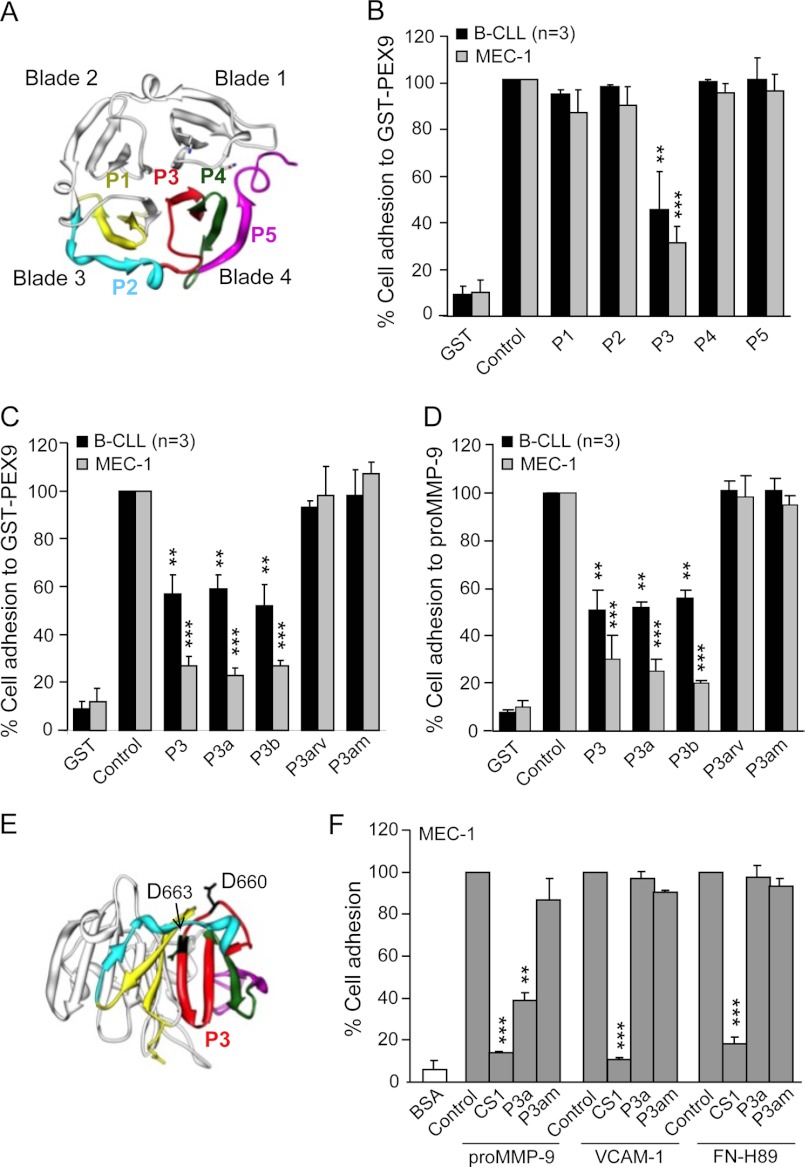
FIGURE 4.
Effect of synthetic peptides derived from the PEX9 domain on B-CLL cell adhesion. A, a ribbon diagram of the monomeric PEX9 domain shows the location in blades 3–4 of the synthetic peptides P1-P5 prepared in this study (see Table 2). B, BCECF-AM-labeled primary B-CLL cells (patients 8, 14, 19) and MEC-1 cells (3 different experiments) with or without previous incubations with the indicated peptides (500 μg/ml, equivalent to 202.8 μm P1, 225.2 μm P2, 197.5 μm P3, 193.5 μm P4, and 227.3 μm P5 concentrations) were added to wells coated with 0.2 μm (B-CLL) or 0.4 μm (MEC-1) GST-PEX9. After 60 min, cell adhesion was quantitated as explained. C and D, BCECF-AM-labeled primary B-CLL cells (patients 4, 8, 14) and MEC-1 cells with or without previous incubation with the indicated peptides (500 μg/ml, equivalent to 197.5 μm P3, 244 μm P3a, 427.4 μm P3b, 244 μm P3arv, 255 μm P3am concentrations) were added to wells coated with GST-PEX9 (C) or proMMP-9 (D), and cell adhesion was measured as explained. E, spatial localization of the Asp-660 and Asp-663 residues of the P3 peptide (shown in red) was determined by the Chimera 1.5.3 Program (RBVI, UCSF). F, BCECF-AM-labeled MEC-1 cells with or without previous incubation with the indicated peptides (all at 500 μg/ml; CS1 at 183.0 μm), were added to wells coated with GST-PEX9 (0.4 μm), FN-H89 fragment (0.2 μm), or VCAM-1 (0.1 μm), and cell adhesion was analyzed as explained. Values are the average of two different experiments with triplicate determinations and were obtained after normalizing control values to 100. **, p ≤ 0.01; ***, p ≤ 0.001.

