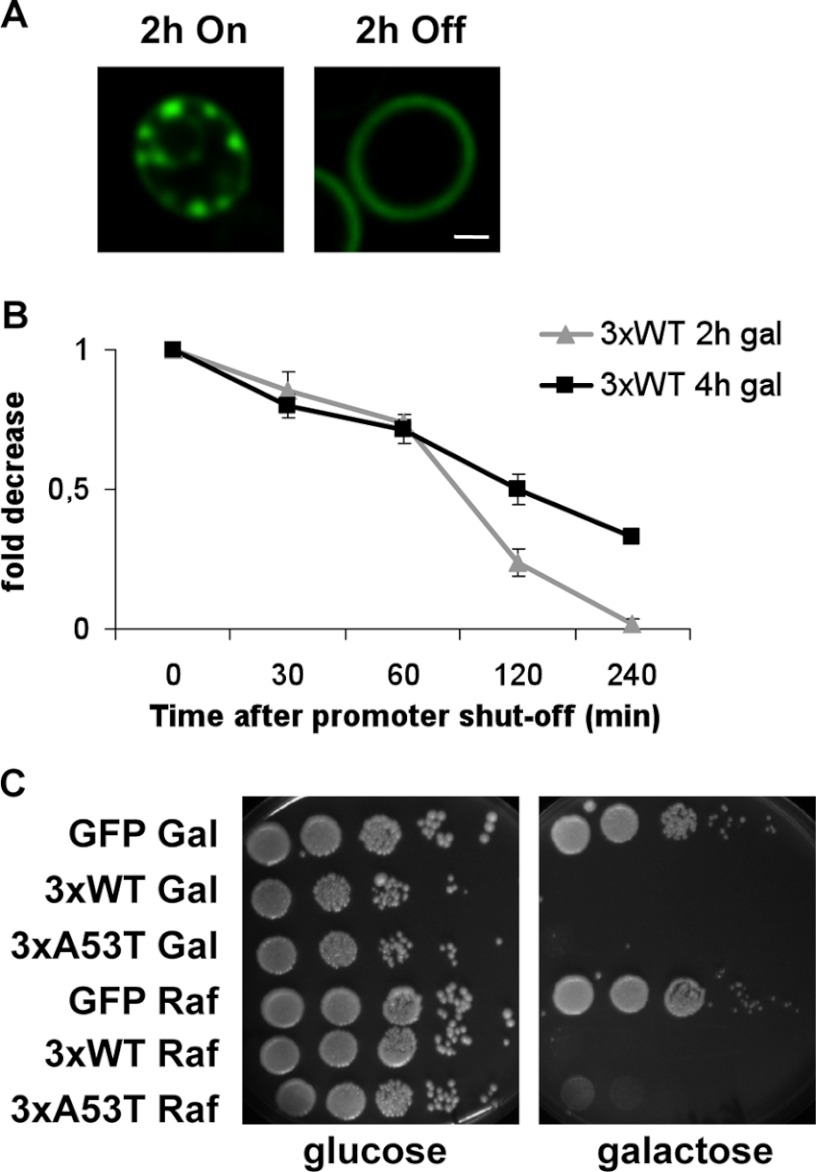
FIGURE 4.
Clearing of α-synuclein aggregates and subsequent recovery of yeast cells from transient α-synuclein exposure. A, live-cell fluorescence microscopy of W303 yeast cells expressing WT α-synuclein-GFP three times-integrated in the genome (3×). Pictures were taken after 2 h of galactose preincubation (left) and 2 h after incubation in glucose (right). Scale bar = 1 μm. B, quantification of cells displaying wild-type α-synuclein-GFP aggregation after promoter shut-off at indicated time points is shown. Preincubation in galactose was done for 2–4 h. C, spotting analysis is shown. Yeast cells were induced in galactose-containing medium to express GFP-tagged WT and A53T α-synuclein from three genomically integrated copies for 8 h. GFP-expressing cells were used as control. The cells were then spotted on glucose and galactose. As the negative control, the same strains were grown in raffinose-containing medium.

