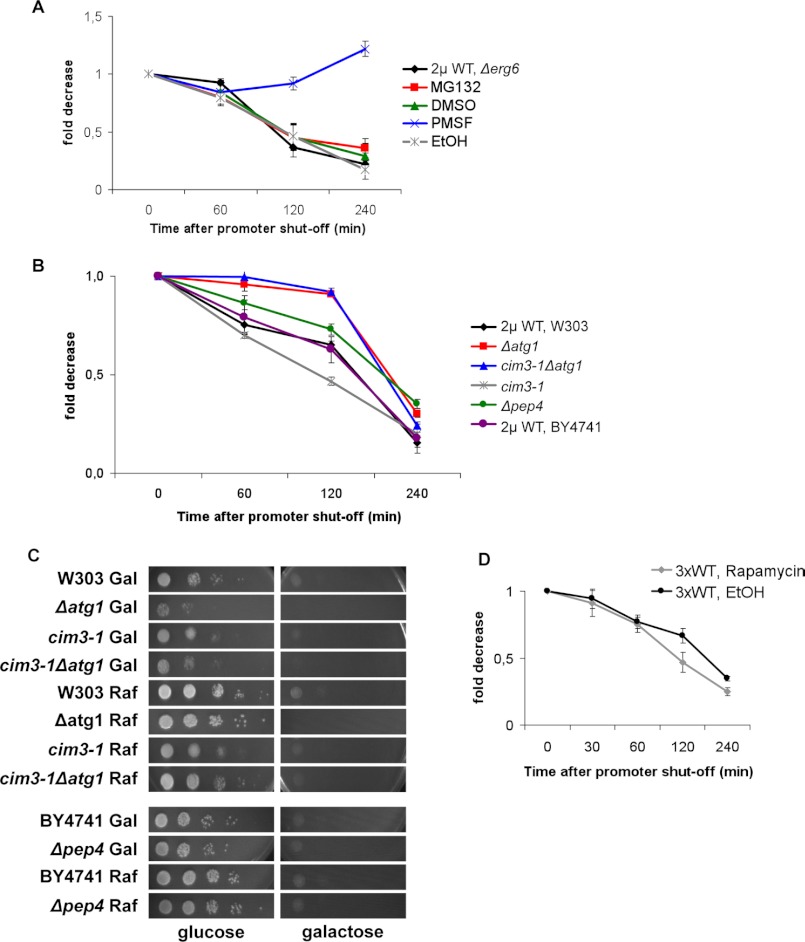
FIGURE 5.
α-Synuclein aggregate clearance upon promoter shut-off in different degradation impairment conditions. A, drug treatments are shown. Aggregation quantification of Δerg6 cells expressing WT α-synuclein-GFP from a high copy plasmid upon promoter shut-off at indicated time points is shown. After 4 h of preincubation in galactose, cells were shifted to glucose medium supplemented with 50 μm MG132 in DMSO or only DMSO and to glucose medium supplemented with 1 mm PMSF dissolved in ethanol (EtOH) or only EtOH. Quantifications were the result of at least three independent experiments (S.D. were less than 10%). B, degradation-related mutants are shown. Aggregation quantification upon promoter shut-off. Wild-type (W303 and BY4741), Δatg1, cim3-1, and Δpep4 yeast cells were preincubated in galactose for 4 h to express WT α-synuclein, shifted to glucose, and counted at the indicated time points. C, spotting analyses are shown. W303, Δatg1, cim3-1, cim3-1Δatg1, BY4741, and Δpep4 yeast cells transformed with a high copy plasmid carrying WT α-synuclein-GFP were induced in galactose-containing medium for 8 h. The same strains were grown in raffinose-containing medium for control. Cells were spotted on glucose or galactose. D, clearance of α-synuclein aggregates after exposure to rapamycin is shown. Cells expressing GFP-tagged WT α-synuclein from three genomically integrated copies (3×) were induced for 4 h in galactose. At the 3-h time point of induction, the medium was supplemented with 100 nm rapamycin for 1 h followed by washing and shifting the cells to glucose. For control, cells were pretreated with the same volume of EtOH, the vehicle of rapamycin.

