FIGURE 2.
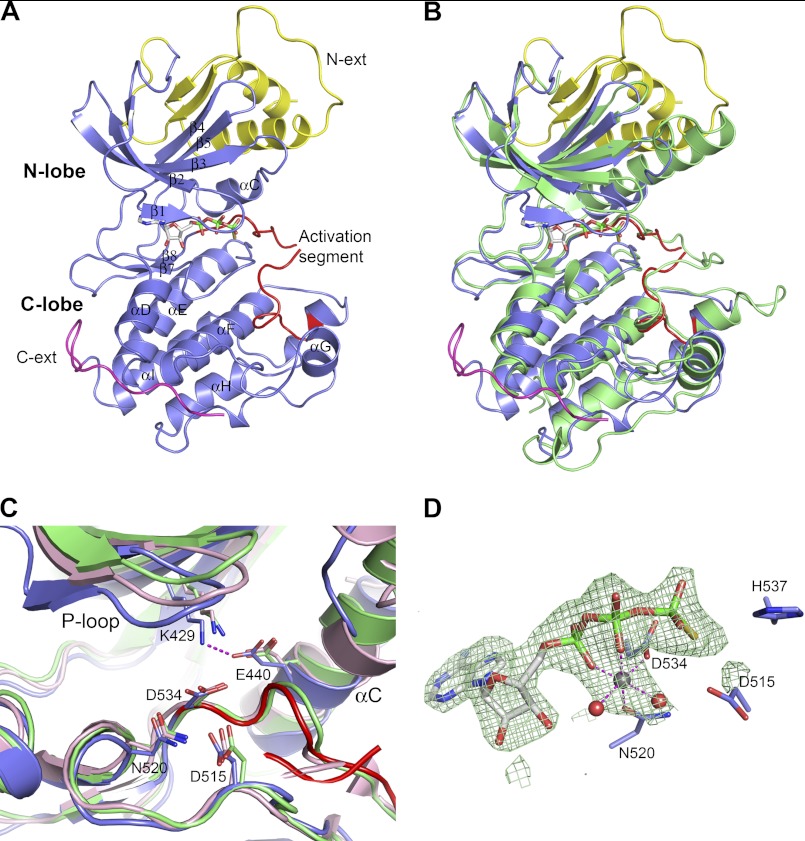
Crystal structure of NIK construct 330–679 in complex with ATPγS. A, overall NIK structure shown in ribbon diagram. The kinase domain is colored in slate with the activation segment highlighted in red. The N-terminal (N-ext) and C-terminal (C-ext) extensions to the kinase domain are colored in yellow and magenta, respectively. ATPγS is shown in stick representation and is atomic color-coded gray for carbon, red for oxygen, blue for nitrogen, yellow for sulfur, and green for phosphorus. N-lobe, N-terminal lobe; C-lobe, C-terminal lobe. B, overall structure comparison of NIK with a constitutively active PhK (Protein Data Bank code 2PHK). NIK is color-coded as described for A, and PhK is colored green. C, ribbon diagram of the NIK kinase domain active site compared with PhK and cAMP-dependent kinase (Protein Data Bank code 1ATP). Residues are shown in atomic color scheme with the carbon color scheme being slate for NIK, green for PhK, and pink for cAMP-dependent kinase. D, the bound nucleotide ATPγS in NIK with omit electron density map contoured at 2.5σ. A Mg2+ ion is shown as a gray sphere, and two water molecules are shown as red spheres.

