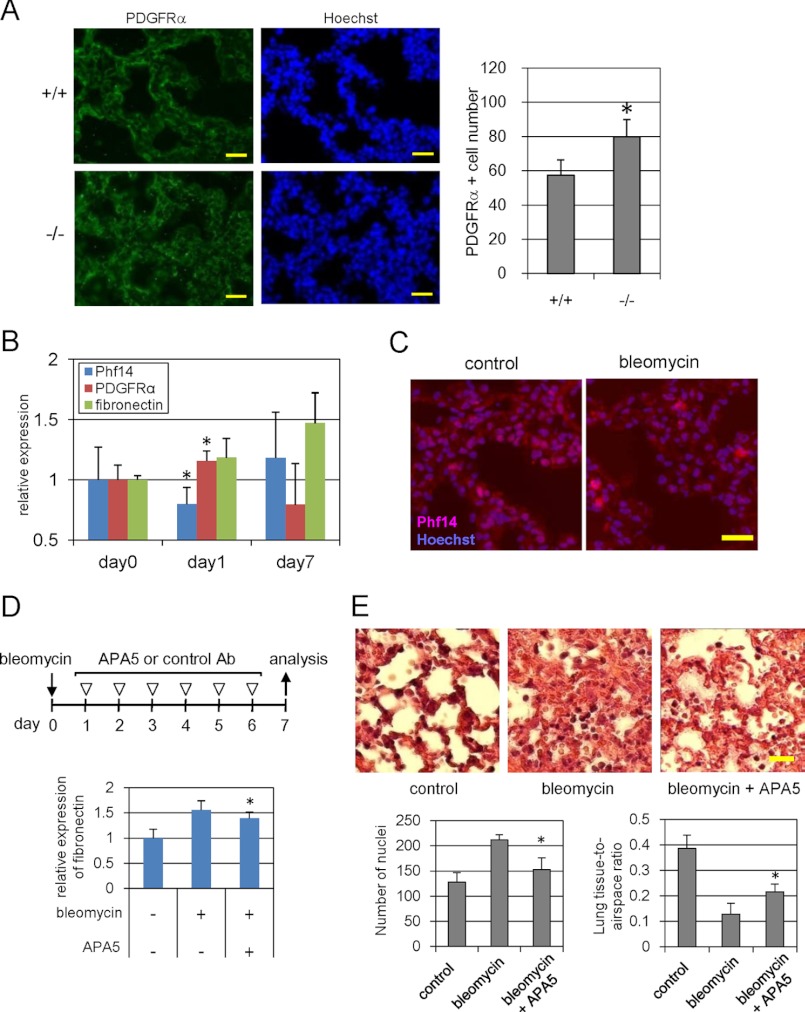
FIGURE 7.
Phf14 expression in bleomycin-induced pulmonary fibrosis. A, immunofluorescence for PDGFRα in E18.5 embryonic lungs. The number of PDGFRα+ cells significantly increased in E18.5 lung sections of Phf14−/− embryos. The number of PDGFRα+ cells in a 200-μm square of the immunofluorescence images is shown in the graph on the right. Nuclei were counterstained with Hoechst 33258. Scale bar, 20 μm. *, p < 0.05 versus Phf14+/+ (n = 3). B, expression of Phf14, PDGFRα, and fibronectin during bleomycin-induced lung fibrosis. After bleomycin treatment, the expressions of Phf14, PDGFRα, and fibronectin were measured on days 0, 1, and 7 by immunoblot analysis. The expression ratio of each protein was calculated relative to that on day 0 (no treatment). *, p < 0.05 versus day 0 (n = 3). C, immunofluorescence for Phf14 in bleomycin-treated lungs. The number of Phf14+ cells in the bleomycin-treated lung tissue decreased. Lung sections on day 1 after treatment were stained with the anti-Phf14 antibody. Nuclei were counterstained with Hoechst 33258. Scale bar, 20 μm. D, effect of anti-PDGFRα antibody administration on bleomycin-induced lung fibrosis. The expression of fibronectin, a fibroblastic marker, decreased after antibody treatment. After bleomycin or saline treatment, mice were treated with APA5, and anti-PDGFRα antibody that antagonizes PDGFRα signaling, or control IgG as indicated (upper panel). The expression of fibronectin in lung tissue was measured on day 7 by immunoblot analysis. The expression ratio was calculated relative to that of control (no treatment). *, p < 0.05 versus bleomycin treatment (n = 3). E, histological findings of lung tissues of D. The hypertrophy of alveolar walls that is strikingly observed in bleomycin-treated lung (center) was reversed by antibody treatment (right). Frozen sections of each lung tissue were also subjected to hematoxylin and eosin staining. Scale bar, 20 μm. The number of nuclei stained with hematoxylin in a 200-μm square was counted and expressed as mean ± S.D. in the graph on the left, below. The lung tissue-to-airspace ratio was calculated from the alveolar airspace area divided by the measured tissue area of a 200-μm square and expressed as mean ± S.D. in the graph on the right, below. *, p < 0.05 versus bleomycin treatment (n = 3).

