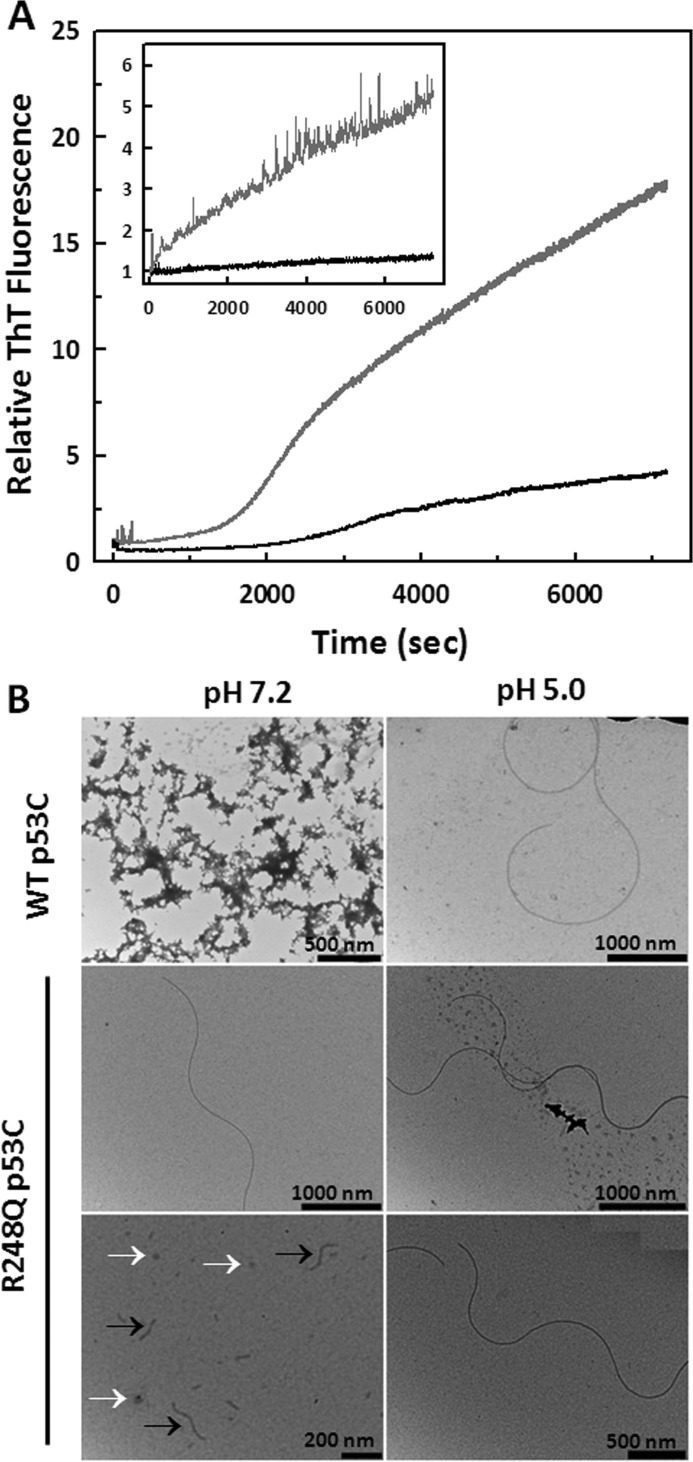
FIGURE 1.
Aggregation kinetics and morphology of WT p53C and mutant R248Q 37T aggregates. A, samples at 5 μm were incubated at 37 °C for 2 h in the presence of ThT at a 5 ThT:1 protein molar ratio at pH 7.2 or pH 5.0. The aggregation was monitored over time based on the increase in ThT fluorescence emission (excitation 450 nm; emission 480 nm) for WT p53C at pH 7.2 (black line) and R248Q at pH 7.2 (gray line). Inset: WT p53C at pH 5.0 (black line) and R248Q at pH 5.0 (gray line). B, images obtained using 5 μm of each sample incubated at 37 °C for 30 min. Black and white arrows indicate fibrillar and oligomeric aggregates, respectively. Scale bars are shown in each figure.

