
FIGURE 5.
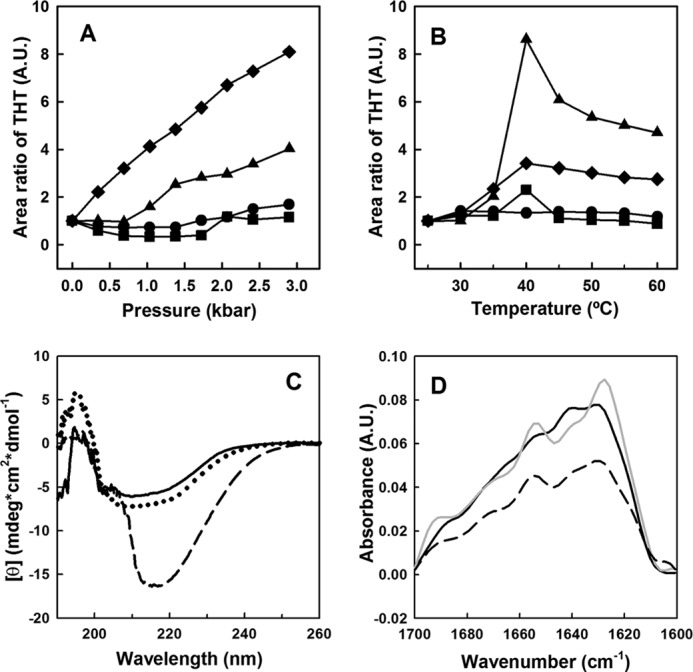
Characterization of WT p53C and R248Q aggregation induced by high pressure, high temperature, or incubation at 37 °C for 2 h. A, WT p53C at pH 7.2 (diamond) or pH 5.0 (circle) and R248Q at pH 7.2 (triangle) or pH 5.0 (square) at 5 μm were subjected to increasing pressures (up to 3 kbar) or to (B) temperatures ranging from 25 °C to 60 °C, and aggregation was monitored according to ThT fluorescence (50 μm). C, Far-UV CD spectra of R248Q p53C at pH 7.2 (solid line), pH 5.0 (dotted line) and after HT-induced aggregation at pH 5.0 (dashed line). ThT was excited at 450 nm, and light emission was collected from 470 to 530 nm. D, FTIR spectra of non-aggregated R248Q p53C (solid line) and 37T-aggregate of R248Q p53C obtained at pH 7.2 (dashed line) or at pH 5.0 (gray).