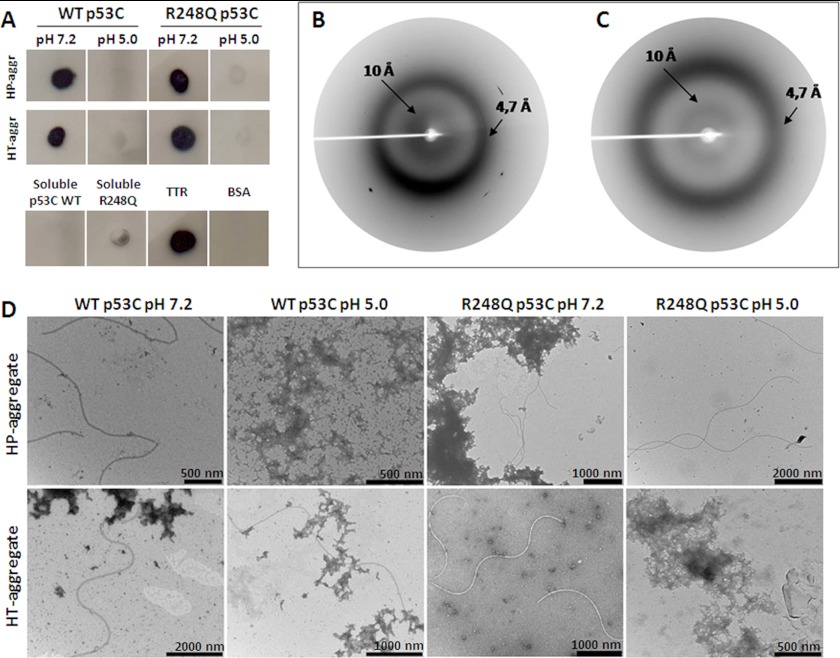
FIGURE 6.
p53C amyloid aggregates characterized by dot-blot immunoassay (A), x-ray diffraction (B and C), and TEM (D). A, HP aggregate, HT aggregate, or WT p53C at pH 7.2, WT p53C at pH 5.0, R248Q at pH 7.2, R248Q at pH 5.0, soluble WT p53C, soluble R248Q, aggregated TTR, and soluble BSA. X-ray diffraction spectra of (B) p53C WT and (C) the R248Q HP-aggregate at pH 7.2. D, TEM analysis of the HT and HP aggregates of WT p53C and R248Q at pH 7.2 and pH 5.0. Samples at 5 μm were subjected to increasing temperatures up to 60 °C and pressures up to 3 kbar at 37 °C, and TEM images were collected immediately after the treatments.

