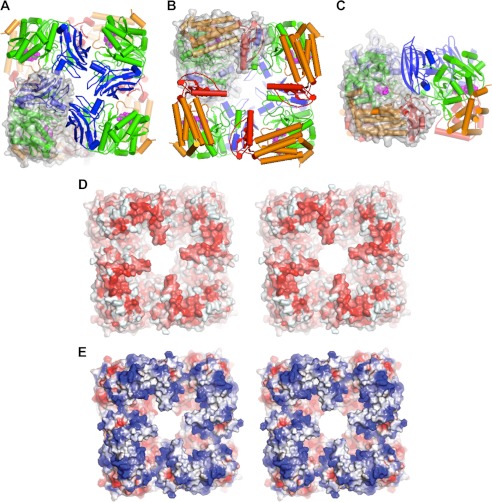
FIGURE 3.
A, N-face view of the GlfT2 tetramer, with each protomer colored as in Fig. 1, and a single protomer drawn with semi-transparent surface representation superimposed. B, C-face view of the tetramer. C, view rotated 90° from the views in A and B, showing a side view of the tetramer. D and E, stereoscopic views of the C-face view of the unliganded GlfT2 tetramer, showing the extent of the hollow central core of the enzyme. D, hydrophobic surface potential representation (red, hydrophobic; white, polar) (53). E, electrostatic surface potential representation (red, negatively charged; white, neutral; blue, positively charged).

